
Figure 2.
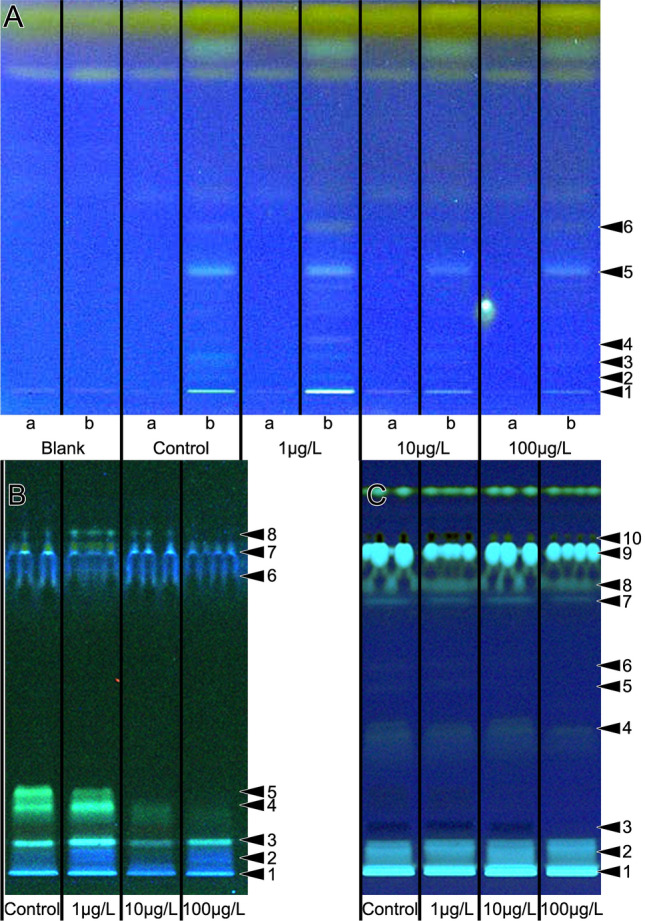
Lipid profiles of worker jelly samples (A) and larvae (B, C) from week 3. Samples of worker jelly (A) were taken using absorptive filter strips (Sugi strips), extracted with n-hexane and separated by HPTLC. Each Sugi strip was halved: one half without the sample (track a) and the other with absorbed sample (track b). A fresh Sugi strip from the same batch as the strips used in the experiment cut in two equal halves served as the blank. The lanes are labeled to show the dose of clothianidin treatments (control = no clothianidin). The analysis of larvae is shown before (B) and after derivatisation (C). For worker jelly, the declining quantity of substances was observed for the lipid profiling (UV 366 nm after derivatization). The latter also was evident for the larvae. Numbers on the right side indicate differences, see SFig 3B, F and H.