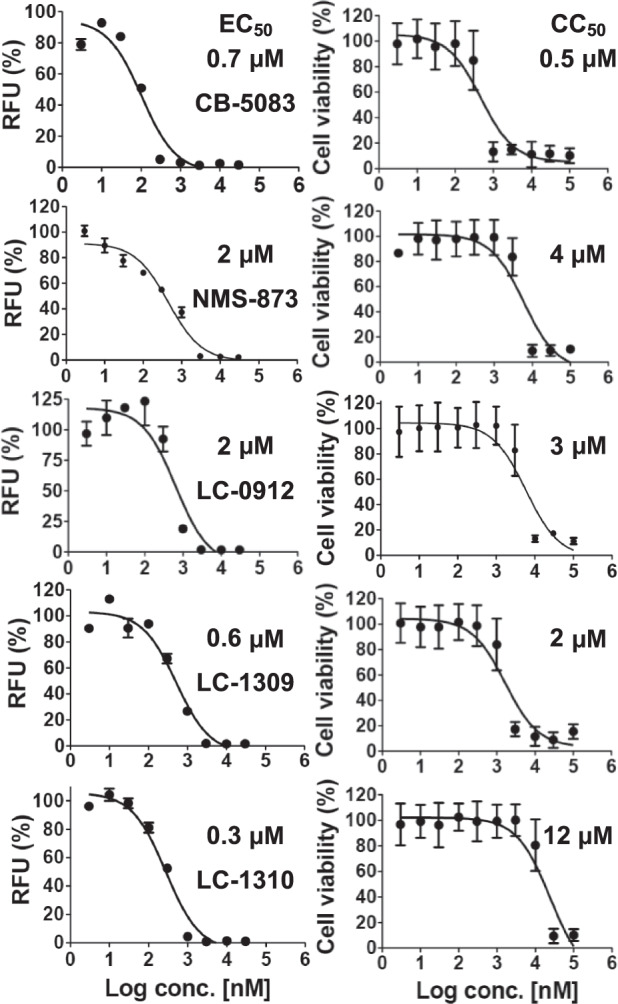
Fig. 2.

Dose-response analysis of p97 inhibitors for anti-HCMV activity. Dose-response analysis of p97 inhibitors for anti-HCMV activity. HFFs were inoculated with GFP reporter HCMV and then the compound was added. Six days later, cells were lysed and GFP expression determined. (RFU relative fluorescence units). For cell viability determination, the compound was added to HFFs and 6 days later cell viability measured by an MTS assay. The EC50 (left graph) and CC50 (right graph) values and curves were determined by comparing mean activity for nine or ten serial dilutions of compound and vehicle (DMSO)-treated cells using GraphPad Prism software. The values listed are the mean of 2–3 dose–response determinations (also listed in Table 1) and representative graphs for each compound are shown
