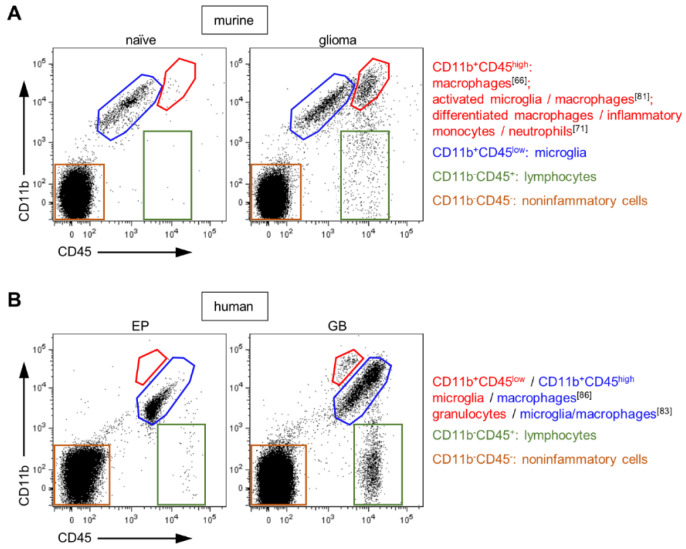
Figure 1.
Flow cytometry analyses of brain tissues by CD11b and CD45 staining. (A) Depicted are dot plots of a naïve mouse brain and a glioma-bearing (GL261) hemisphere (adapted from Brandenburg et al. [15]). Dead cells were excluded for analyses by DAPI+ staining. In all publications using rodent glioma models, the CD11b+CD45low population is described as microglia. In contrast, the CD11b+CD45high population is referred to different cell fractions as indicated. Blue-marked cell fraction: CD11b+CD45+ population present in naïve and tumor-bearing brains. (B) Dot plots of human brain tissues from an epilepsy patient (EP) and a patient suffered from glioblastoma (GB) are presented (adapted from Blank et al. [81]). DAPI+ cells were excluded from analyses. For humans, data are not consistent about composition of the entire CD11b+CD45+ population. Blue-marked cell fraction: CD11b+CD45+ population present in EP and GB specimens, implicating a contribution of microglia.

