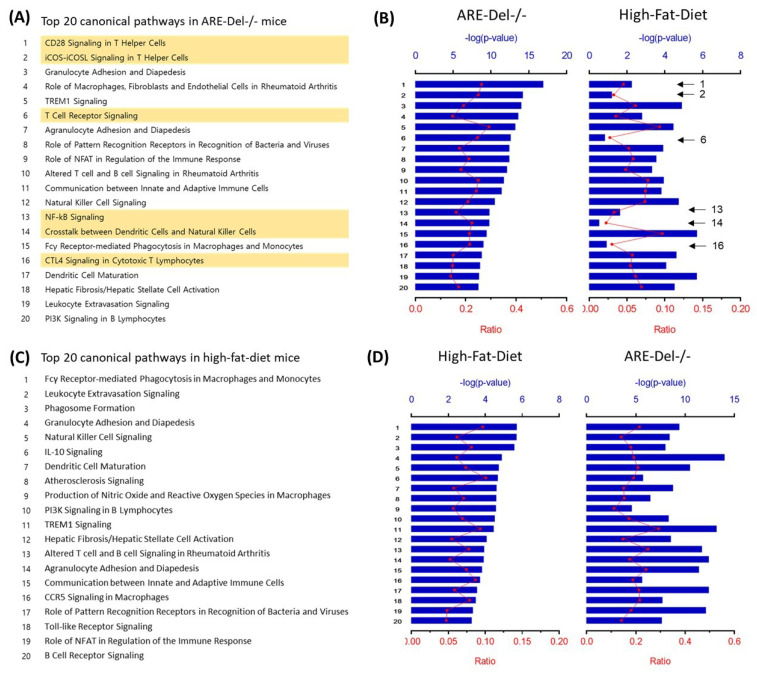
Figure 1.
The comparison of altered pathways between high-fat-diet and ARE-Del-/- mice. (A) The top 20 altered pathways in ARE-Del-/- mice. Yellow marks represent pathways specifically increased in ARE-Del-/- mice compared tohigh-fat-diet mice; (B) Overlapping pathways of high-fat-diet mice were aligned with those in (A); (C) The top 20 altered pathways in high-fat-diet mice; (D) Overlapping pathways of ARE-Del-/- mice were aligned with those in (C). Ratio (bottom y-axis, red line) refers to the number of genes from the dataset divided by the total number of genes that make up that pathway from within the ingenuity pathway analysis (IPA) knowledge base. The -log of the p-value (top y-axis, bar) was calculated by Fisher’s exact test.

