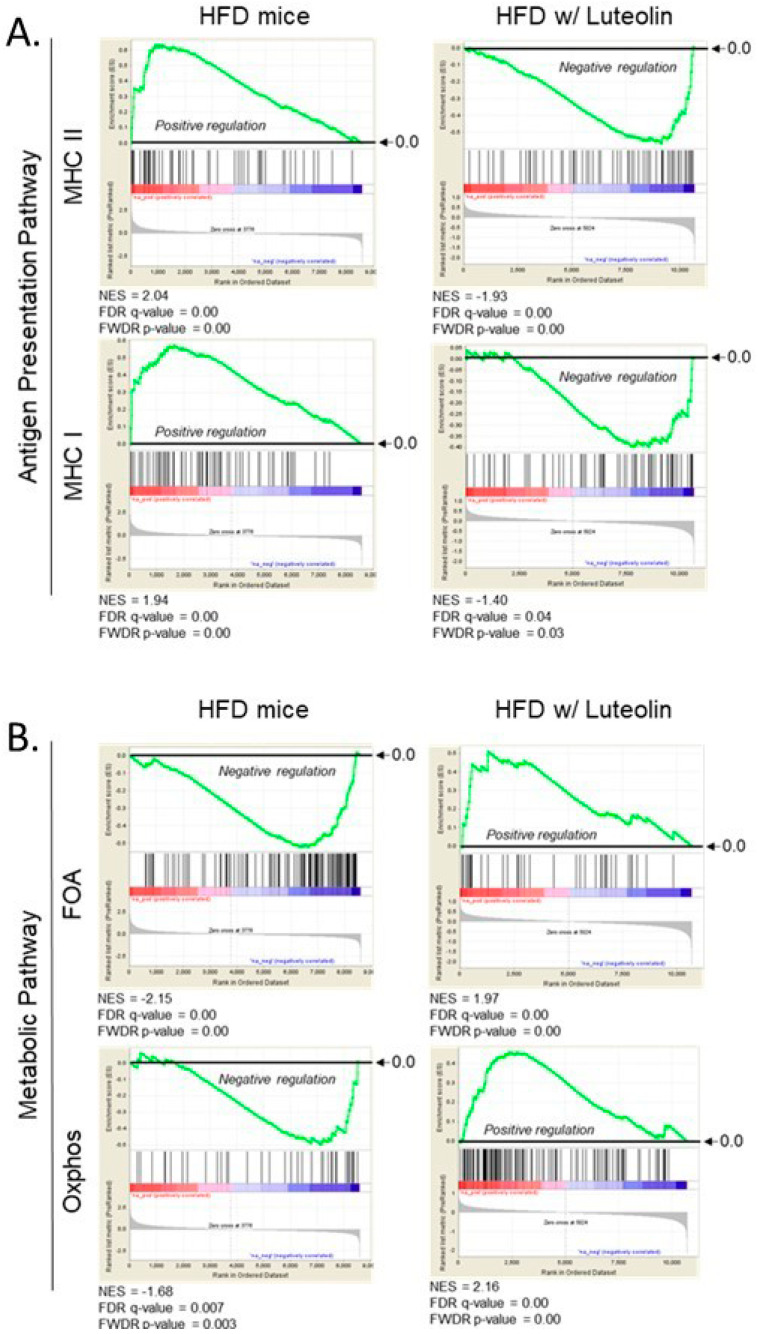
Figure 2.
Gene Set Enrichment Analysis (GSEA) of antigen presentation pathways (A) and metabolic pathways (B) in high-fat-diet mice with/without luteolin treatment. (A) Expression of MHC-I and MHC-II gene sets in high-fat-diet mice with and without luteolin treatment; (B) Expression of FAO and Oxphos gene sets in high-fat-diet mice with and without luteolin treatment. FDR, false discovery rate; FWER, family wise error rate; NES, normalized enrichment scores.

