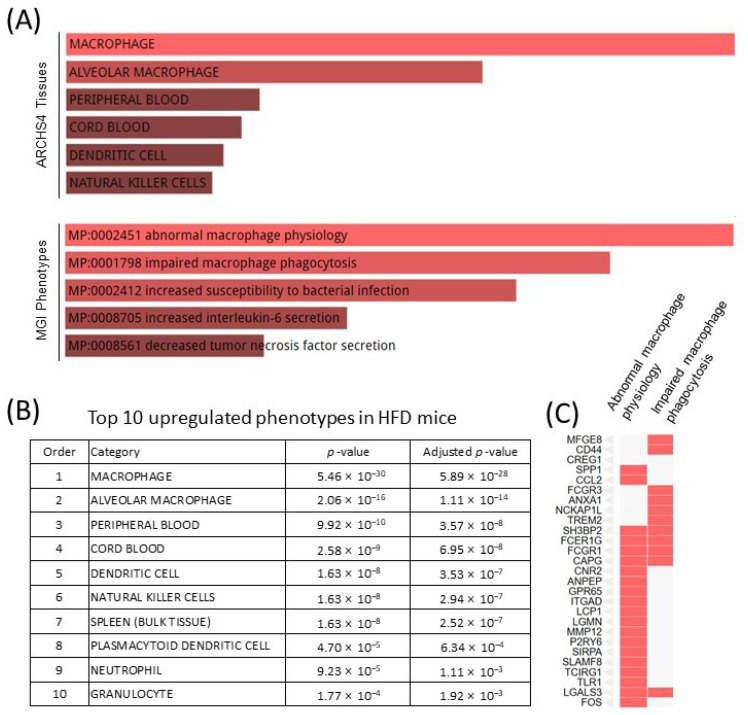
Figure 3.
Pathway analysis of upregulated genes in the liver of HFD mice. (A) Abnormal macrophage function predicted by pathway analysis based on ARCH4 and MGI phenotypes databases; (B) The top 10 upregulated phenotypes according to the ARCH4 database; (C) A cluster graph of gene expression profiles of abnormal macrophage physiology and impaired macrophage phagocytosis in the MGI phenotypes database.

