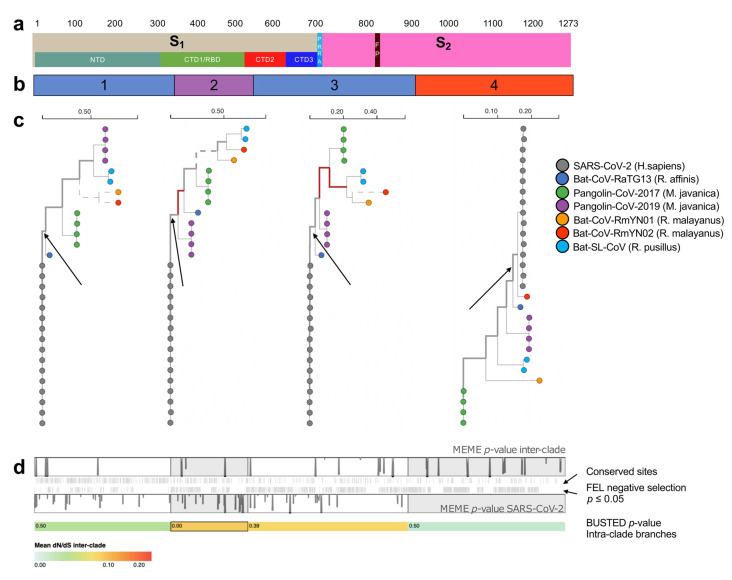
Figure 1.
Selection analyses of S glycoprotein. Selection analyses were applied to a partitioned alignment of 29 CoV genomes. (a) Structure of the S gene. S1: subunit 1; S2; subunit 2; NTD: N-terminal domain; CTD1-3: C-terminal domain; RBD: receptor-binding domain; FP: fusion peptide. (b) Genetic fragments inferred at recombination analysis. The colors indicate the closest relative as shown by the maximum likelihood trees in panel c. (c) A maximum likelihood tree (rooting is arbitrary) for each genetic fragment is shown, and the inter-clade branches where host switch events might have occurred are indicated with thicker lines; branches where episodic selective pressure were detected (aBSREL p ≤ 0.05) are shown in red. Branches longer that 0.25 subs/site (under the MG94 codon model in aBSREL analyses) are censored at 0.25 subs/site and shown in dashed lines. (d) The impact of selective forces at individual sites is shown in two vertical bars at the top, where MEME p-values are shown either for the SARS-CoV-2 clade (bottom bar) or the inter-clade branches (top bar) as trail plots on top of each genetic fragment indicated here for simplicity by alternating white and grey rectangles. Tick-marks between the bars correspond to the location of sites that were inferred to be subject to pervasive purifying selection along the inter-clade branches, and sites where the amino-acid is conserved among all analyzed clades. The colored bar shows mean dN/dS along inter-clade branches (MG94 model) and the p-value for segment-wide episodic positive selection on the segment for intra-clade branches (BUSTED p ≤ 0.05)

