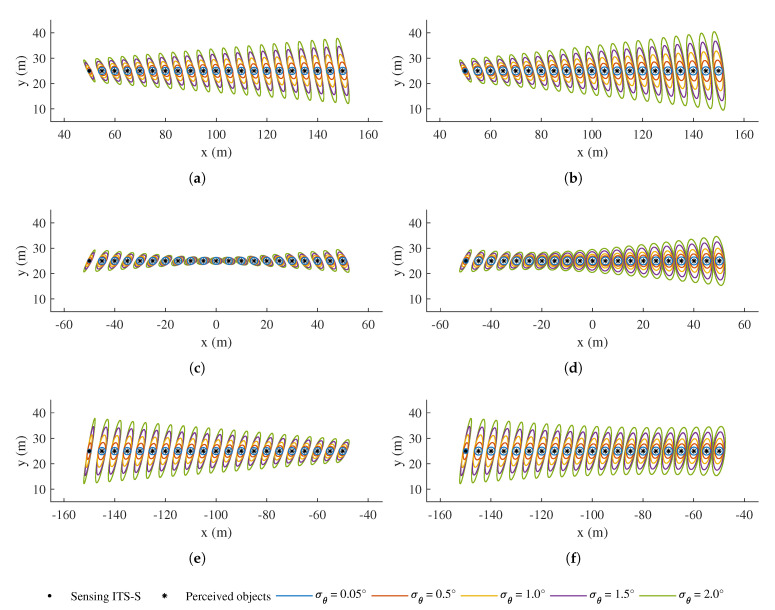
Figure 11.
Confidence ellipses of perceived objects transformed to the local frame of the receiving CAV in Test 1, where different heading estimate standard deviations are tested for CAV(s). As the receiving CAV moves, (a,c,e) show the results at different relative positions between IRSU and the receiving CAV, while (b,d,f) present the results for the V2V case. In each subfigure, the first object on the left represents the position of the sensing ITS (visualised as a black dot) after being transformed to the receiving CAV’s local frame, while its perceived objects are denoted by black star markers. The receiving CAV sits at the origin in each subfigure. Each ellipse represents 95% of position estimate confidence.

