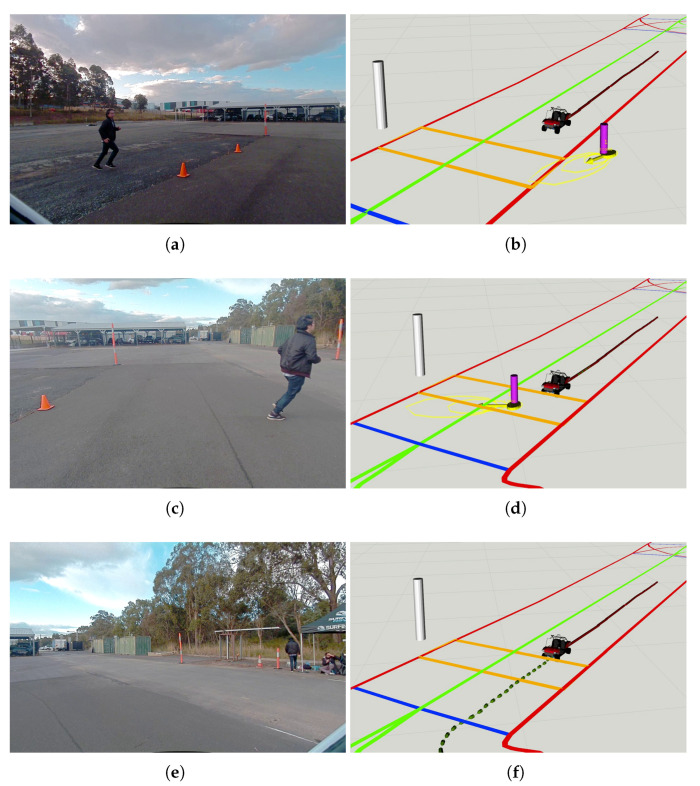
Figure 22.
The CAV gave way to a running pedestrian at the designated crossing area in a lab environment. Based on the ETSI CPMs broadcast by the IRSU, the CAV predicted the state of the running pedestrian up to 1.5 s into the future. The IRSU is visualised as a tall white pillar in the CAV in (b,d,f). It is seen in (b) that the predicted states of the pedestrian, visualised as yellow ellipses, intersected with the orange crossing area on the Lanelet2 map. The CAV stopped for the pedestrian in front of the crossing in (d). The CAV then planned a new path forward after the pedestrian finished crossing in (f). In (a,c,e), image frames from front-left, front-centre, front-right cameras on the CAV are presented, respectively.

