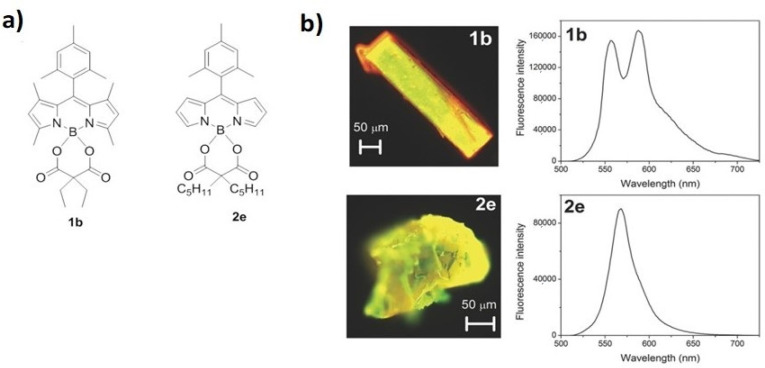
Figure 10.
(a) Structure of compounds 1b and 2e. (b) Fluorescence images and spectra of solid crystals of representative compounds 1b and 2e were recorded under excitation at 450–490 nm with a fluorescence microscope. Reproduced from Ref. [88] with permission from 2016 WILEY-VCH Verlag GmbH & Co. KGaA, Weinheim, Germany.

