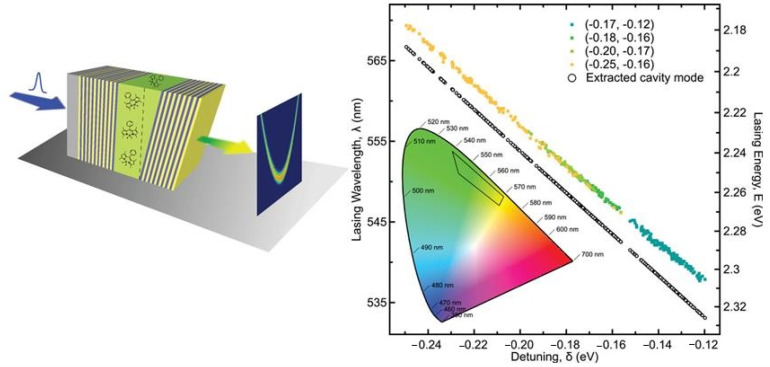
Figure 18.
(left) Schematic representation of the wedged dye-filled microcavity and the excitation and detection configuration. (right) The colored solid-square data points indicate the wavelength (photon energy, right axis) where polariton lasing was observed versus the corresponding exciton–photon detuning. The black open circles indicate the corresponding bare cavity mode for each realization. Polariton lasing spans the green-yellow part of the visible spectrum as indicated with a black solid line on the CIE 1931 chromaticity diagram, bottom left inset. Reproduced from Ref. [106] with permission from 2019 WILEY-VCH Verlag GmbH & Co. KGaA, Weinheim, Germany.

