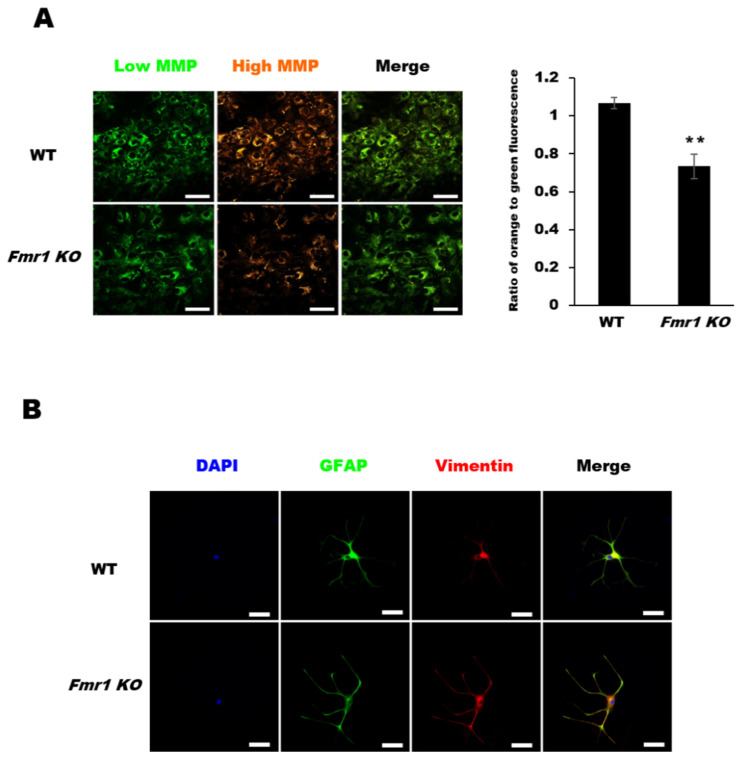
Figure 5.
Mitochondrial membrane potentials (MMPs) and vimentin distribution in astrocytes of Fmr1 KO. (A) The mitochondrial membrane potential of astrocytes was determined using MITO-ID®, which contains a cationic dye that fluoresces green at low mitochondrial membrane potential (MMP) and orange at high MMP. Astrocytes (DIV27) were incubated with MITO-ID® for 30 min and then visualized by confocal microscopy (left). Astrocytes from Fmr1 KO mice showed lower MMP than astrocytes from WT mice (right). Representative images are shown at 400× magnification. Each value represents the mean ± SD (n = 8 per group). ** p < 0.01 vs. WT astrocytes. Scale bars, 50 μm. (B) Double immunofluorescence staining with anti-GFAP and anti-vimentin in astrocytes from WT and Fmr1 KO mice. Astrocytes of Fmr1 KO showed abnormal localization of the vimentin intermediate filament (VIF). Scale bars, 50 μm.

