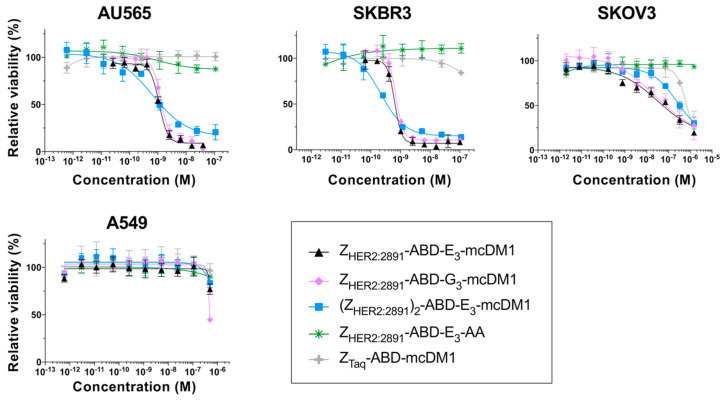
Figure 2.
In vitro cytotoxicity analysis of the conjugates. The cytotoxicity was determined by incubating serial dilutions of the conjugates with the cell lines indicated above the panels. The relative viability of the cells is plotted on the Y-axis as a function of the conjugate concentration on the X-axis. The relative viability of cells cultivated in complete medium was used for normalization to 100% viability. Each datapoint corresponds to the average of four independent experiments and the error bars correspond to 1 SD.

