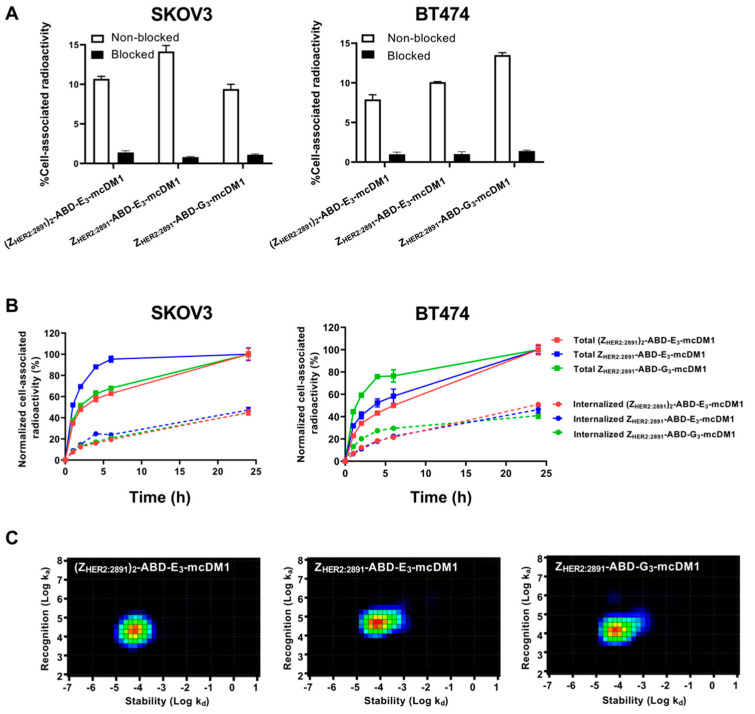
Figure 3.
Cell binding and cellular processing of 99mTc-labeled AffiDCs. (A) SKOV3 and BT474 cells were incubated with radiolabeled AffiDC with or without pre-saturation with a 500-fold molar excess of the same AffiDC lacking radiolabel, blocked or non-blocked, respectively. The Y-axis corresponds to the measured total radioactivity of the cells as a percentage of the total radioactivity added to each well. (B) Cellular processing of 2 nM conjugates by SKOV3 and BT474 cells during continuous incubation over 24 h. Data were normalized to the recorded value at 24 h, which was set to 100%, and are presented as mean with error bars corresponding to 1 SD. (C) Interaction maps for the interaction between 99mTc labeled AffiDCs and SKOV3 cells. The maps were derived by InteractionMap software from real-time biosensor measurements in a LigandTracer instrument. The x-axis corresponds to the dissociation rates and the y-axis corresponds to the association rates of the interactions in each graph.

