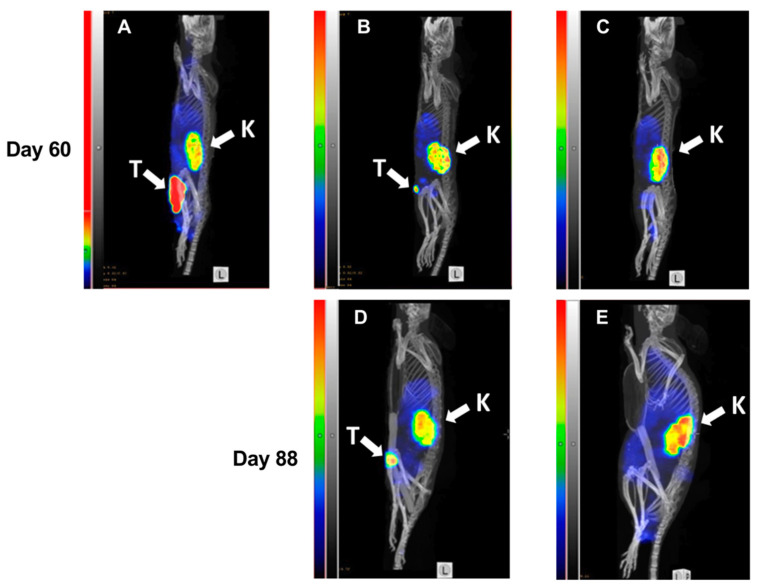
Figure 7.
MicroSPECT/CT imaging of HER2-expression in BALB/c nu/nu mice bearing SKOV3 xenografts. Maximum Intensity Projections, sagittal view. Imaging was performed at days 60 (A–C) and 88 (D,E) of the experimental therapy. A mouse from the PBS-treated control group with a large necrotic tumor (A). A mouse with a small tumor from the group treated with ZHER2:2891-ABD-E3-mcDM1 (15.1 mg/kg) at day 60 (B) and at day 88 (D). A mouse without any visible tumor from the group treated with ZHER2:2891-ABD-E3-mcDM1 (10.3 mg/kg) at day 60 (C) and at day 88 (E). The relative scale in (A) was adjusted to the same level of activity in kidneys for (B–E).

