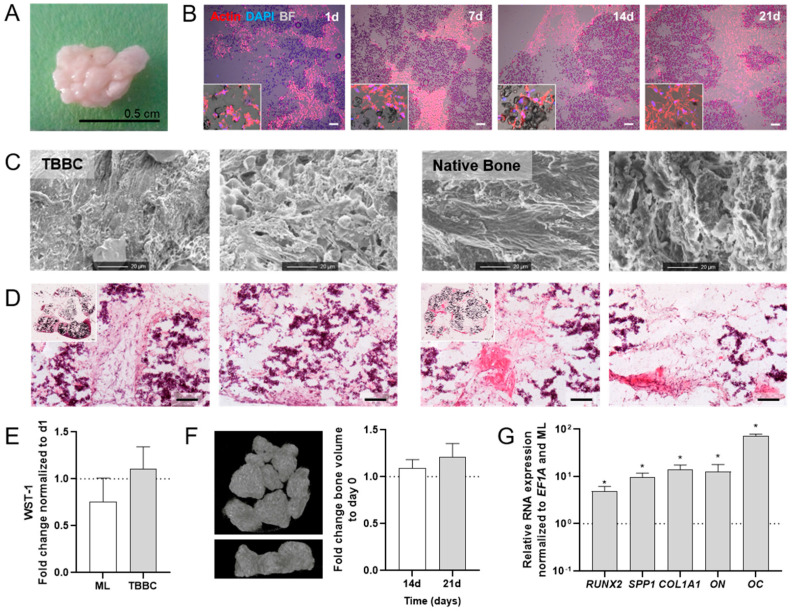
Figure 4.
Human in vitro 3D TCP-based bone component (TBBC) based on MSCs. (A) Macroscopic overview of the in vitro 3D TBBC. (B) Exemplary images to highlight cell localization and extracellular matrix formation as shown by immunofluorescence staining for actin (red) and DAPI (blue) after day 1, 7, 14 and 21. Bright field (BF) shows the β-TCP scaffold. Exemplary images of n = 4 (scale bar = 100 µm). (C) Structural examination of the TBBC in comparison to native bone using scanning electron microscopy. Exemplary images of n = 8 TBBC and n = 2 human native bone. (D) Histological evaluation of the morphology via H&E staining. Exemplary images for n = 8. Scale bars indicate 100 µm. (E) WST-1 assay was conducted to confirm metabolically active cells after 21 days of cultivation compared to day 1 and monolayer control (ML). Data are shown as mean ± SEM (duplicates per donor in two independent experiments) for n = 6. Mann-Whitney U-test was used to determine the statistical significance. (F) In vitro 3D µCT reconstruction and quantitative results. Data are shown as mean ± SEM for n = 3. (G) Total RNA extraction was performed from ML and TBBCs after 21 days of osteogenic differentiation. The relative gene expression was normalized to the housekeeper gene EF1A and osteogenic differentiated ML. Data are shown as mean ± SEM (duplicates per gene) for n = 6. Wilcoxon Signed Rank Test was used to determine the statistical significance; p‑values are indicated in the graphs with * p < 0.05. MSC, mesenchymal stromal cell; TCP, tricalcium phosphate; EF1A, eukaryotic translation elongation factor 1 alpha.

