Figure 6.
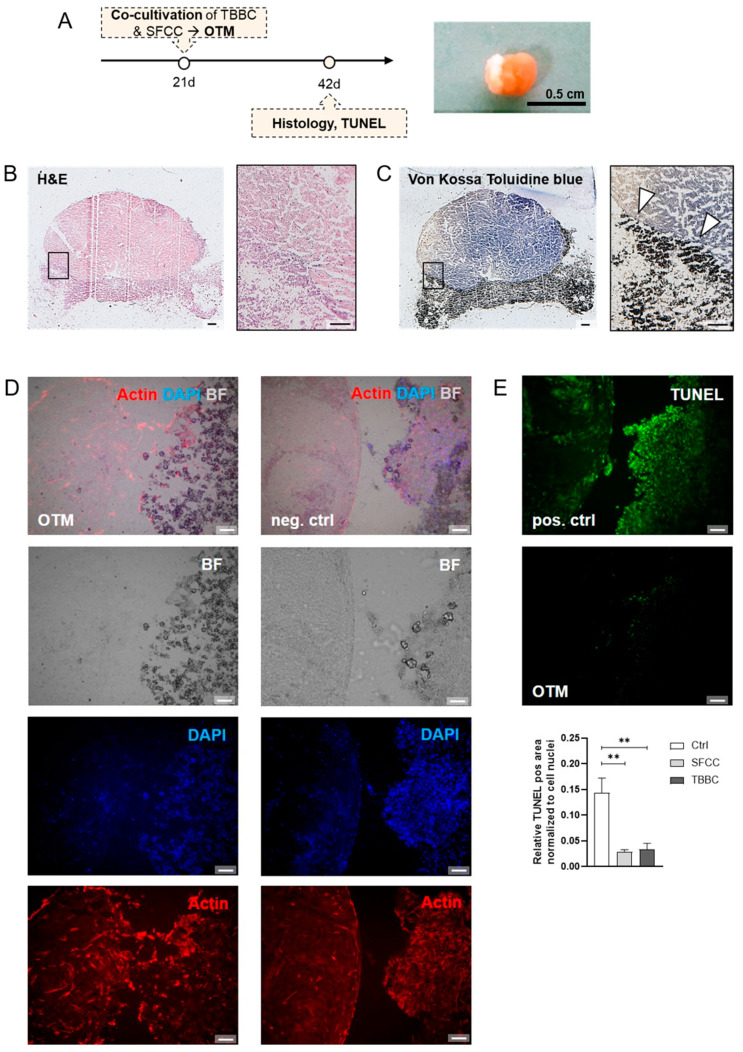
Human in vitro 3D osteochondral tissue model (OTM). Both components were developed independently and subsequently co-cultured in a cell culture insert for 21 days. (A) Experimental design of the in vitro 3D OTM. (B) Histological evaluation via H&E and (C) Toluidine blue combined with von Kossa staining. Exemplary image for n = 4. Scale bars indicate 500 µm. White asterisks highlight initial mineralization. (D) Actin and DAPI staining were performed to visualize the transitional bridging area between both components. Neg. ctrl = co-cultivation for 1 day, simulating a not unified OTM. Exemplary image for n = 4. Scale bars indicate 200 µm. (E) The number of apoptotic cells (green; TUNEL staining) normalized to cell nuclei (DAPI+) in both TBBC and SFCC after 21 days of co-cultivation was quantified via ImageJ. Exemplary images for n = 5. Scale bars indicate 200 µm. Pos. ctrl = incubation with DNase I for 10 min to induce apoptosis. Mann-Whitney U‑test was used to determine the statistical significance compared to the control, p‑values are indicated in the graphs with ** p < 0.01. TBBC, tricalcium phosphate-based bone component; SFCC, scaffold-free cartilage component.

