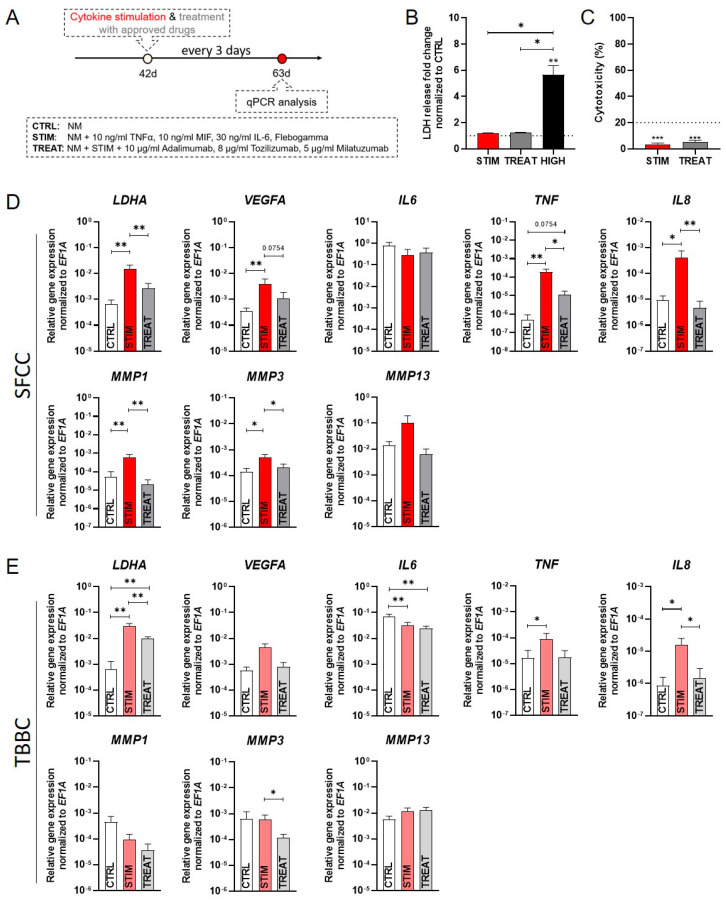
Figure 7.
Experimental results of our osteochondral tissue model incubated for 21 days under non-inflammatory conditions (CTRL), repetitive cytokine stimulation with a cocktail of TNFα, IL-6 and MIF (STIM) and under treatment conditions (TREAT). (A) Schematic overview of the experimental design. (B) LDH-assay was performed after 1 day to cover any cytotoxic effects using supernatant from the OTM treated with cytokines (STIM—10 ng/mL TNFα, 30 ng/mL IL-6, 10 ng/mL MIF) and in combination with clinically available drugs (TREAT—10 µg/mL adalimumab, 8 µg/mL tocilizumab, 5 µg/mL milatuzumab). CTRL = untreated control; HIGH = 2% of Triton X-100 to induce LDH release. Data are shown as mean ± SEM for n = 5. Wilcoxon matched-pairs signed rank test was used to determine the statistical significance between groups and One sample t test for the spontaneous LDH release control (CTRL). (C) Percentage of cytotoxicity was determined by the following equation [%] = (exp. value − CTRL)/(HIGH − CTRL) × 100 for n = 5. Data are shown as mean ± SEM. One sample t test was used with a cytotoxicity cut off of 20% [29]. (D) Gene expression studied via qPCR for LDHA, VEGFA, IL6, TNF, IL8, MMP1, MMP3 and MMP13 for scaffold-free cartilage components (SFCCs) and (E) tricalcium phosphate-based bone components (TBBCs). Data were normalized to the housekeeper gene EF1A and are shown as mean ± SEM (duplicates per gene) for n = 5. Mann-Whitney U-test was used to determine the statistical significance, p‑values are indicated in the graphs with * p < 0.05, ** p < 0.01, *** p < 0.001. LDH, lactate dehydrogenase; TNF, tumor necrosis factor; IL, interleukin; MIF, macrophage migration inhibitory factor; LDHA, lactate dehydrogenase A; VEGFA, vascular endothelial growth factor A; MMP, matrix metalloproteases; EF1A, eukaryotic translation elongation factor 1 alpha.

