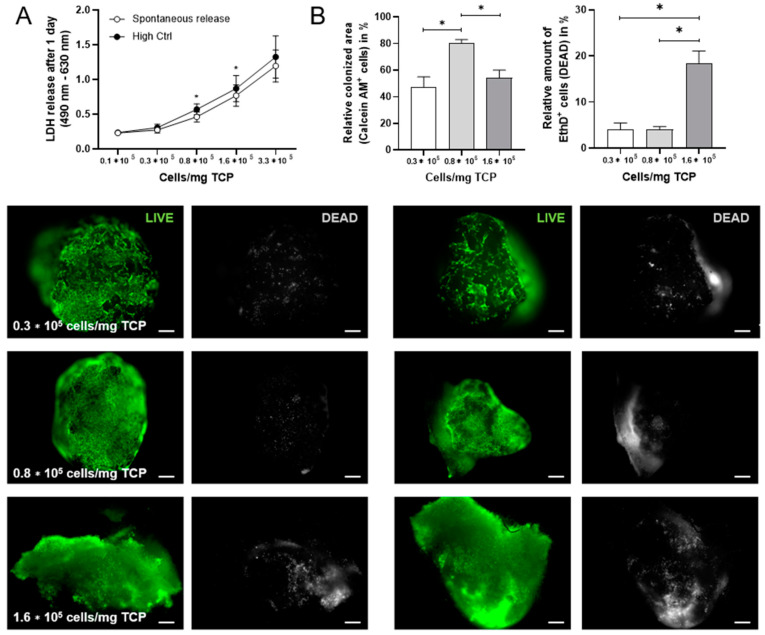
Figure A1.
Cell number/mg TCP. (A) LDH assay was performed after 1 day and different cell densities (0.1 × 10⁵, 0.3 × 10⁵, 0.8 × 10⁵, 1.6 × 10⁵, 3.3 × 10⁵ cells/mg TCP). High Ctrl = 2% of Triton X-100 to induce LDH release. Data are shown as mean ± SEM (duplicates per donor) for n = 4. For statistical analysis the Wilcoxon matched-pairs signed rank test was used; * p < 0.05. (B) LIVE/DEAD staining was performed after 21 days and different cell densities (0.3 × 10⁵, 0.8 × 10⁵, 1.6 × 10⁵ cells/mg TCP). Images were quantified using ImageJ. Green and grey colors discriminated between living and dead cells (scale bars = 100 µm). Representative images are shown accordingly for n = 5. Data are shown as mean ± SEM. For statistical analysis the Wilcoxon matched-pairs signed rank test was used; * p < 0.05. TCP, tricalcium phosphate; LDH, lactate dehydrogenase.

