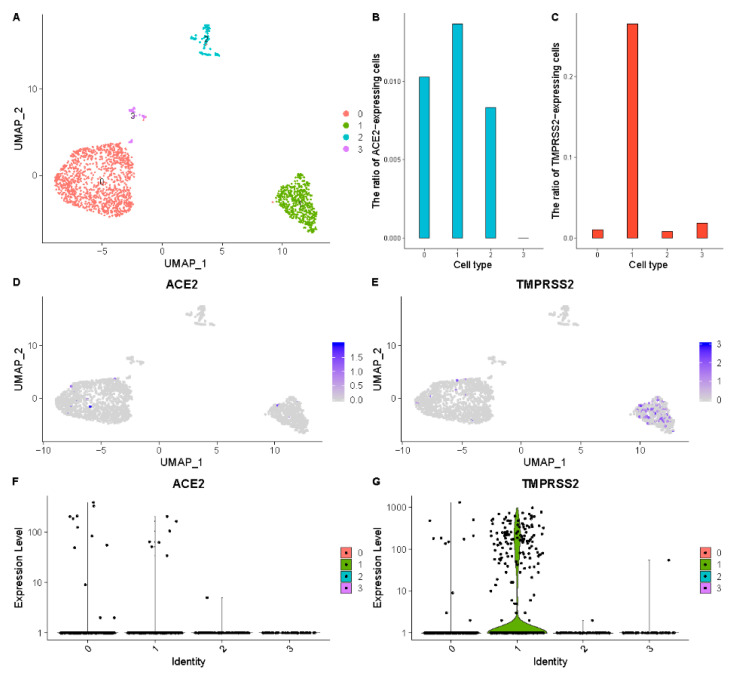
Figure 3.
High ACE2 and TMPRSS2 expression levels of epithelial cells and ovarian somatic cells in the fallopian tube. (A) UMAP visualization of clustering results for the fallopian tube cells. (B) in each cell cluster. (C) in each cell cluster. (D) ACE2 expression level in each cell cluster on the UMAP plot. (E) TMPRSS2 expression level in each cell cluster on the UMAP plot. (F) The expression distribution of ACE2 across each cell cluster. (G) The expression distribution of TMPRSS2 across each cell cluster.

