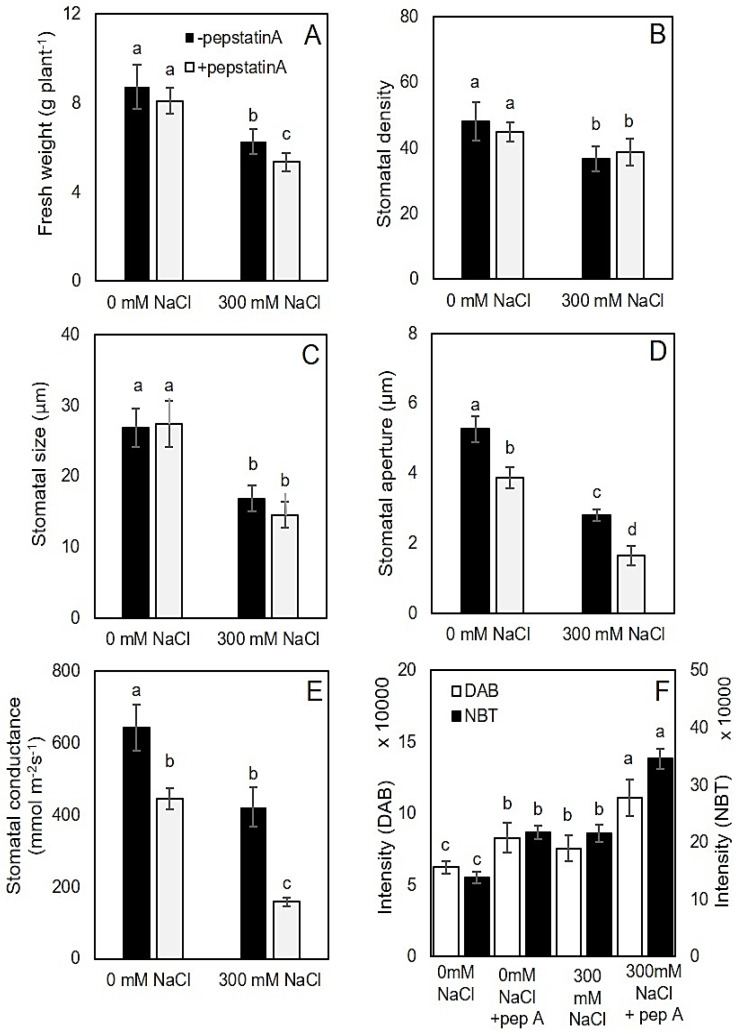
Figure 8.
The effects of salinity stress and pepstatin A on different quinoa characteristics. (A) Fresh weight; (B) stomatal density; (C) stomatal size; (D) stomatal aperture; (E) stomatal conductance; (F) intensity of 3,3’-diaminobenzidine (DAB) and NBT staining in the GC as indicator of hydrogen peroxide and superoxide radical production. Data labelled with different lower-case letters (a–d) are significantly different at p < 0.05 based on Tukey’s test.

