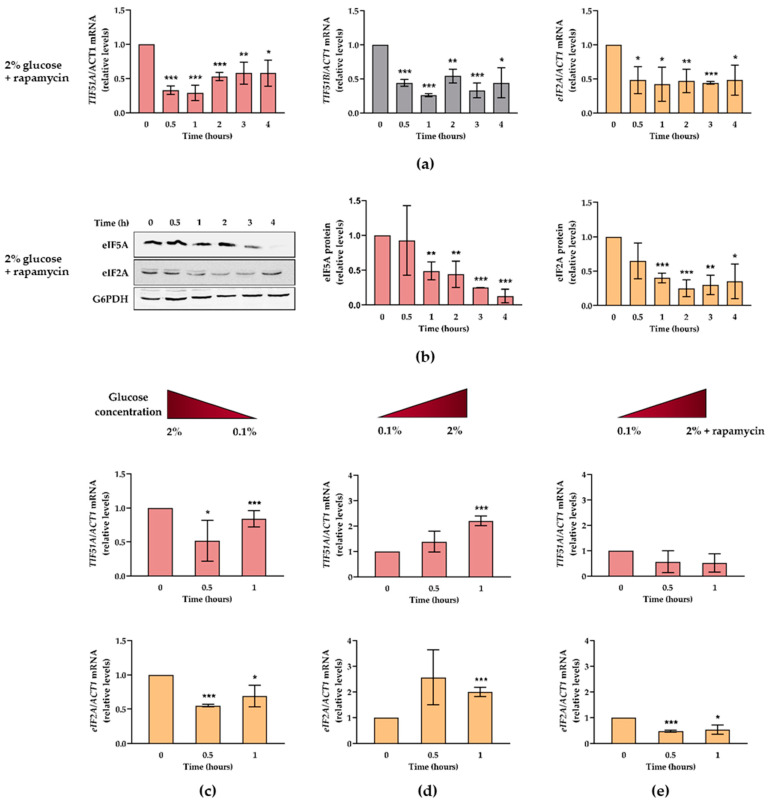
Figure 4.
eIF5A expression is regulated by glucose concentration and TORC1 pathway. (a,b) WT cells were grown in YPD medium with the addition of 200 ng/mL rapamycin for 4 h. (a) The relative TIF51A, TIF51B, and eIF2A (from left to right) mRNA levels were determined. (b) Western blotting and quantification analysis of proteins eIF5A and eIF2A (from left to right). G6PDH protein levels were used as loading controls. A representative experiment is shown of three independent experiments. (c) The WT cells were grown in the YEP medium containing 2% glucose and transferred to the YEP medium containing 0.1% glucose for 1 h. (d,e) The WT cells were grown in the YEP medium containing 0.1% glucose and transferred to the YEP medium containing 2% glucose without (d) or with (e) the addition of rapamycin for 1 h. (c–e) The relative TIF51A (up) and eIF2A (down) mRNA levels were determined. (a–e) The results are shown as the means ± SD of three independent experiments and are expressed in relation to the value for time 0. Statistical significance was measured by a Student’s t-test in relation to time 0. * p < 0.05, ** p < 0.01, *** p < 0.001.

