Figure 3.
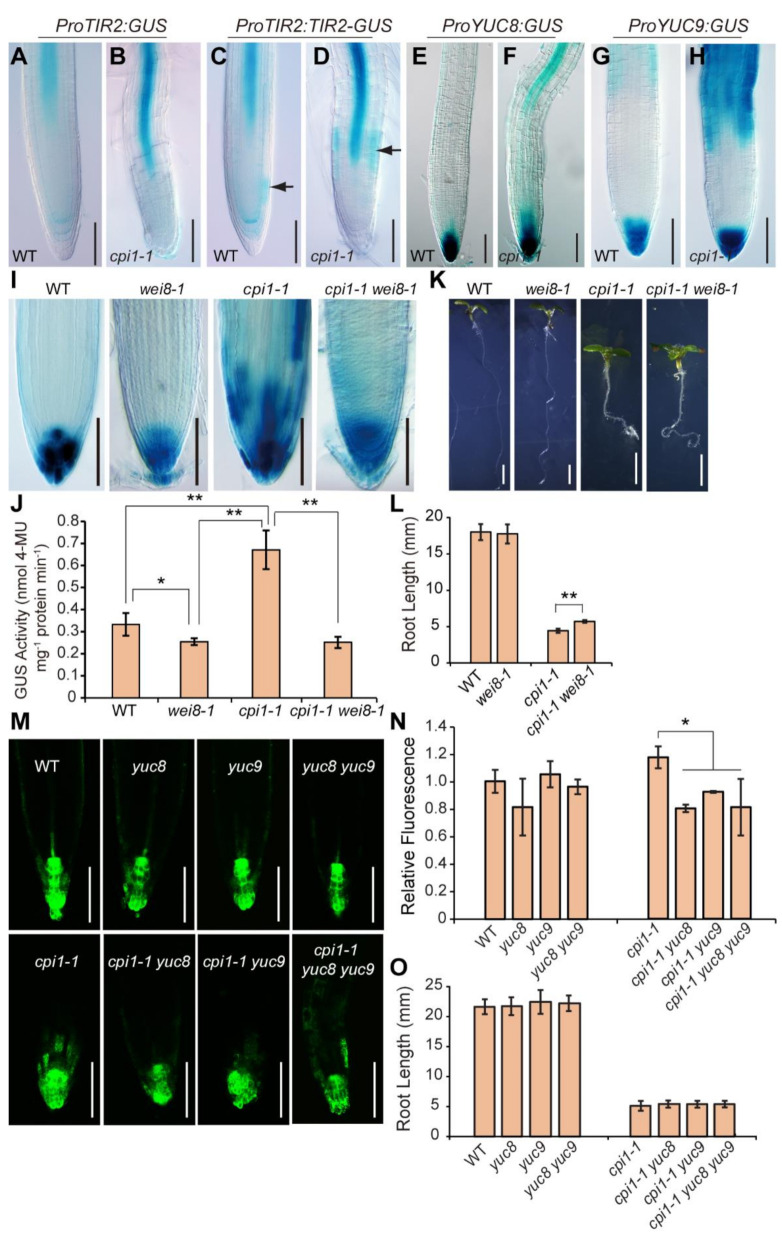
Auxin biosynthesis gene promoter activity is enhanced in cpi1-1 and the cpi1-1 short root phenotype is partially suppressed by the wei8-1 mutation. (A–H) Expression patterns of ProTIR2:GUS, ProTIR2:TIR2-GUS, ProYUC8:GUS, and ProYUC9:GUS in 5-day-old WT and cpi1-1 seedling roots. Shown are representative images of n = 3 independent experiments (employing 6 to 30 seedlings per experiment). The arrow in (C) indicates GUS staining in the root proximal meristem; The arrow in (D) indicates GUS staining in the elongation zone; (I) Expression patterns of DR5:GUS in root tips of 5-day-old WT, wei8-1, cpi1-1, and cpi1-1 wei8-1 seedlings. Shown are representative images of three independent experiments (employing 18 to 32 seedlings per experiment); (J) Quantitative DR5:GUS activity assay in 5-day-old seedlings. The presented data are means ± SD of n = 3 independent experiments. * p < 0.05, ** p < 0.01 (one-way ANOVA with Tukey’s test); (K,L) Phenotypes (K) and root length (L) of 7-day-old seedlings. The presented data are means ± SD of n = 3 experiments (employing 13 to 28 seedlings per experiment). ** p < 0.01 (Student’s t-test, one-tailed, two-sample equal variance); (M,N) Expression patterns of DR5rev:GFP in root tips (M) and quantification of GFP fluorescence (N). The presented data are means ± SD of n = 3 independent experiments (employing 6 to 11 roots per experiment). * p < 0.05 (one-way ANOVA with Tukey’s test); (O) Root length of 7-day-old seedlings. The presented data are means ± SD of n = 3 independent experiments (employing 9 to 28 seedlings per experiment). No significant difference between cpi1-1 single and cpi1-1 yuc8 and cpi1-1 yuc9 double and cpi1-1 yuc8 yuc9 triple mutants by one-way ANOVA (p < 0.05). Bars = 100 μm in (A–I,M) and 2 mm in (K).

