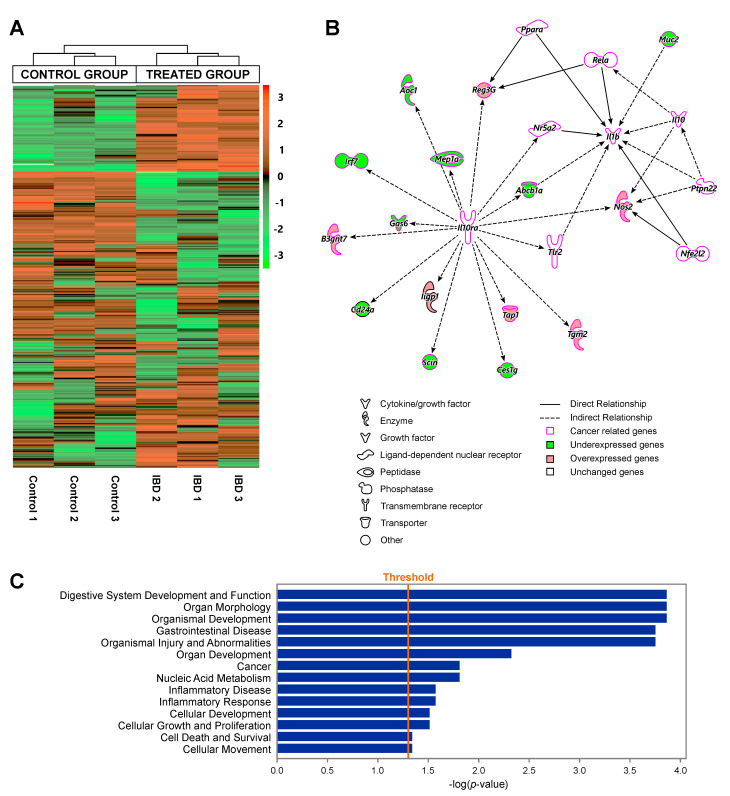
Figure 4.
Transcriptome profiling of proximal colon in inflammatory bowel disease (IBD) and control mice: (A) unsupervised hierarchical clustering based on the 500 genes with the highest variances, showing a clear separation between control and IBD groups; (B) the network surrounding the top upstream regulator Il10ra as identified by IPA; and (C) diseases and functions predicted to be affected by differentially expressed genes, using Fisher’s exact test at a significance threshold of p = 0.05, via IPA.

