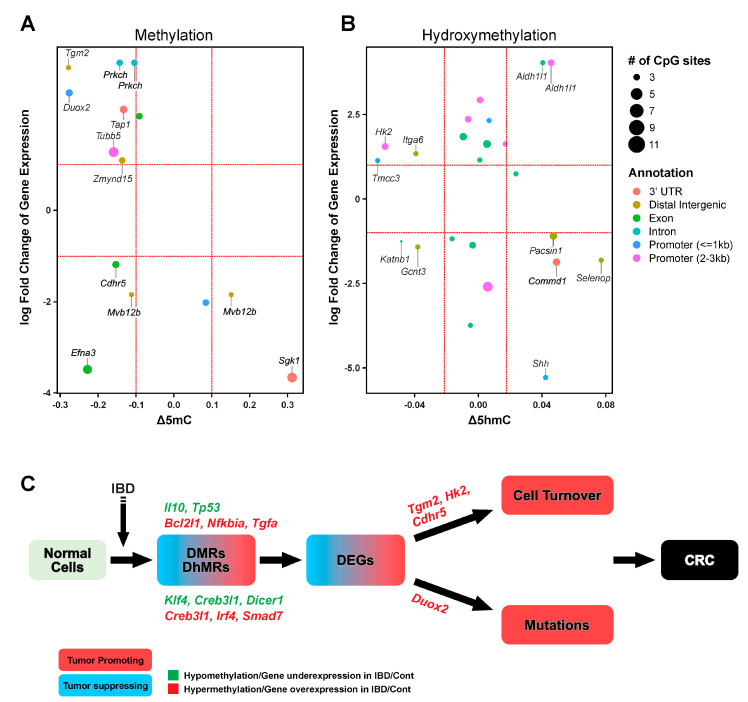
Figure 5.
Correlation between IBD-induced changes in the transcriptome, DNA methylome, and hydroxymethylome: (A,B) the scatterplots show genes that are both differentially expressed and that contain DMRs (A) or DhMRs (B). Colors indicate different genomic features, and the dot size indicates the number of CpGs in each region. (C) A model summarizing the contribution of DNA epigenetic marks in the initiation of IBD-induced colorectal cancer (CRC).

