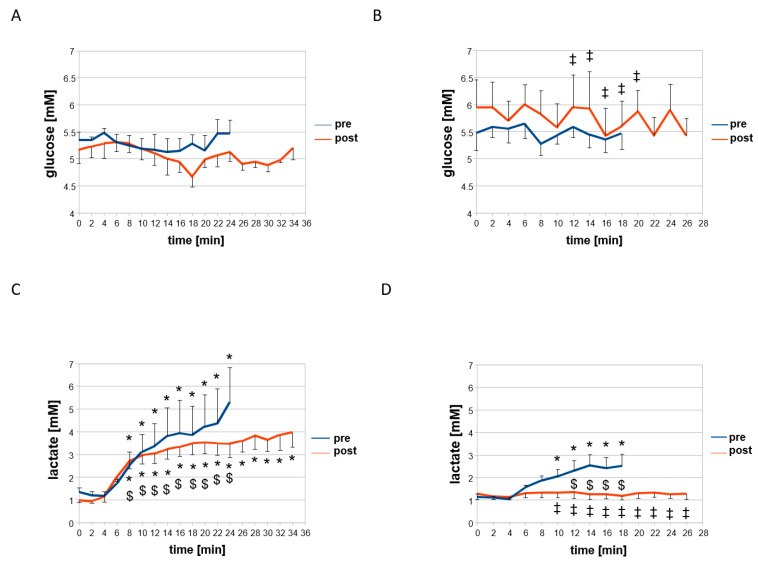
Figure 4.
Temporal response of blood glucose and lactate concentration during concentric and eccentric type of interval exercise. Line graph with whiskers indicating mean values ± SE for blood glucose concentration (A,B) and blood lactate concentration (C,D) as measured each 2 min in the two groups during the interval-type pedaling exercise before and after the eight weeks of training under the concentric (A,C) or eccentric (B,D) contraction protocol. *, p < 0.05 vs. 0 min. ‡, p < 0.05 vs. concentric. $, vs. pre. Repeated-measures ANOVA with post-hoc test of least significant difference.

