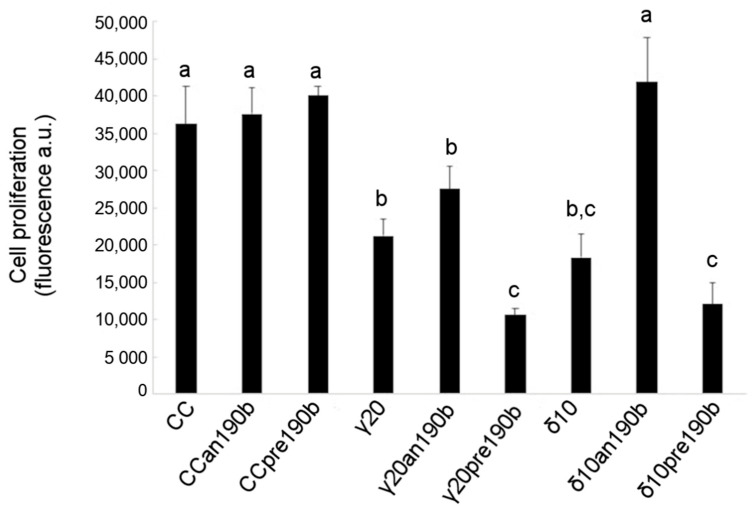
Figure 4.
Effects of γT3 (20 µg/mL for 24 h) and δT3 (10 µg/mL for 24 h) on the proliferation of HeLa cells transfected with pre-miR-190b (pre190b) and anti-miR-190b (an190b). Results are reported as the mean ± SD of data obtained from 5 independent experiments and expressed as arbitrary fluorescence values normalized per 10,000 cells. Bars show a log2 fold-change (treated vs. control, CC). Data were analyzed by one-way ANOVA with repeated measures, followed by Tukey’s test. Different letters (a, b, c) indicate significant differences (p < 0.05).

