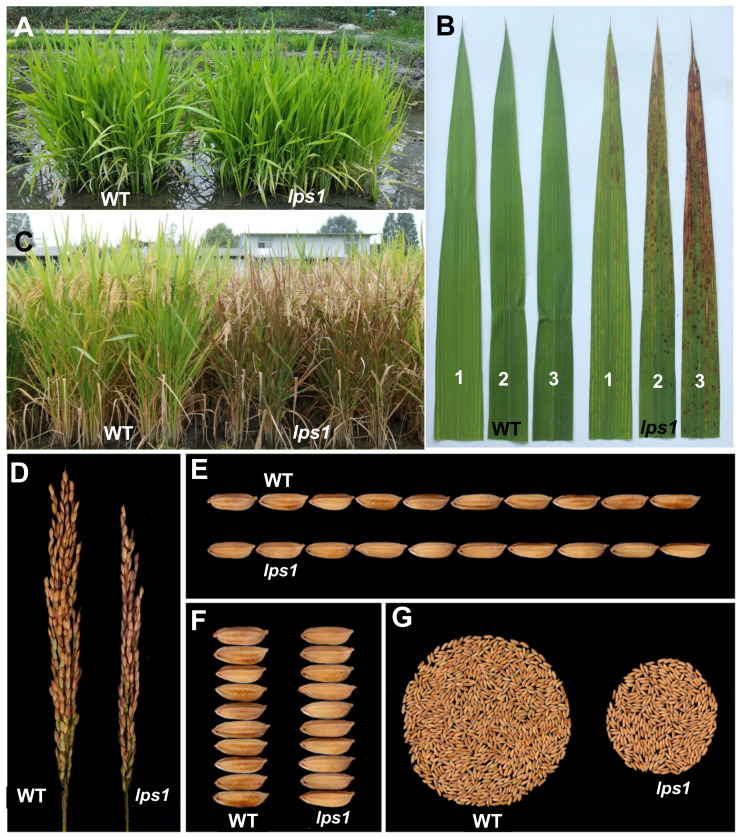
Figure 1.
Phenotypic comparison between wild type (WT) and lps1 mutant. (A) The field phenotype at seedling stage. (B) The top three leaves at heading stage. One, 2 and 3 indicate flag leaf, the 2nd leaf and the 3rd leaf from the top, respectively. (C) The field phenotype at mature stage. (D) Panicle morphology. (E) Grain length. (F) Grain width. (G) Grain yield per plant.

