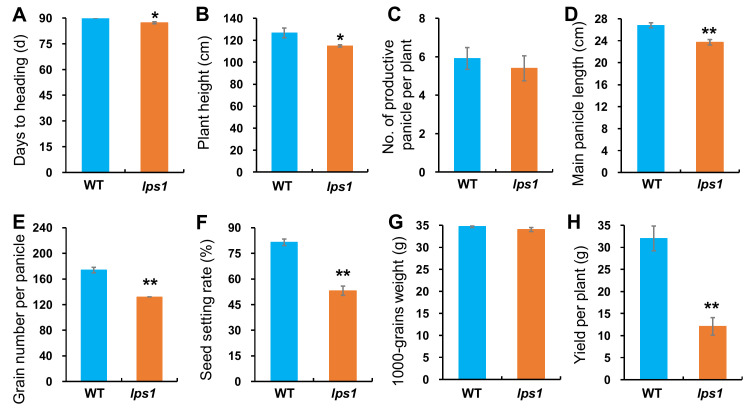
Figure 2.
Comparison of major agronomic traits between WT and lps1. Error bars represent standard deviations of three independent biological replicates. (A) Days to heading. (B) Plant height. (C) Number of productive panicles per plant. (D) Main panicle length. (E) Grain number per panicle. (F) Seed setting rate. (G) 1000-grains weight. (H) Grain yield per plant. The statistically significant differences were performed by Student’s t test. * p < 0.05 and ** p < 0.01.

