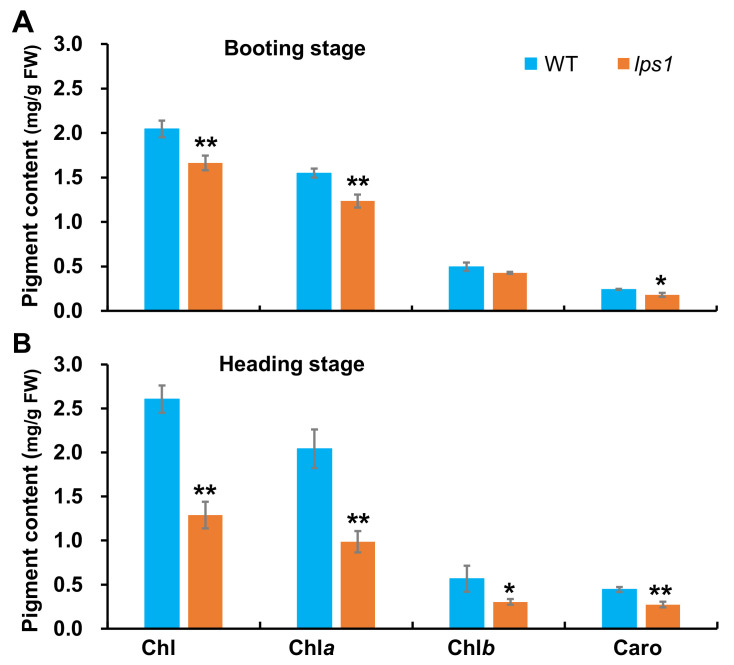
Figure 3.
Pigment contents in leaves of WT and lps1. (A) The top leaf at booting stage. (B) The flag leaf at heading stage. Error bars represent standard deviations of three independent biological replicates. The statistically significant differences were performed by Student’s t test. * p < 0.05 and ** p < 0.01.

