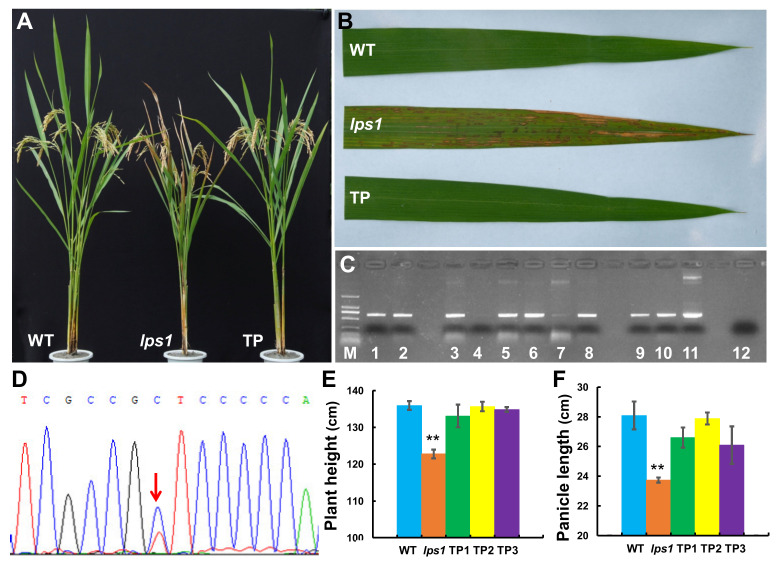
Figure 7.
Complementation analysis of lps1 mutant. (A) Phenotypes of wild type, lps1 and positive transgenic plant (TP) at grain filling stage. (B) Flag leaf of wild type, lps1 and TP plant at heading stage. (C) Identification of transgenic plants by PCR and electrophoresis. M: DL-2000 marker; 1-3, 5, 6 and 8–10: positive transgenic plants; 4 and 7: negative transgenic plants; 11: pCAMBIA1300-OsSDH2-1 plasmid (PCR-positive control); 12: the lps1 mutant (PCR-negative control). (D) Identification of transgenic plants by PCR and sequencing. The red arrow indicates the mutation site, showing double peaks in positive transgenic plants. (E) Plant height and (F) panicle length of wild type, lps1 and TP plant at grain-filling stage. Error bars represent standard deviations of three independent biological replicates. The statistically significant differences were performed by Student’s t test. ** p < 0.01.

