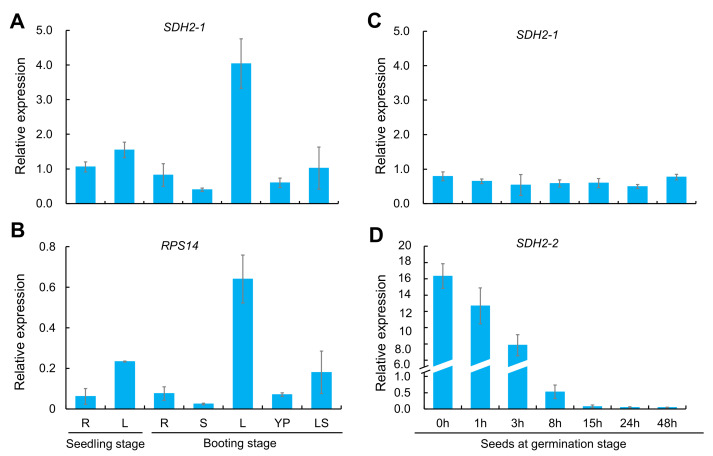
Figure 11.
Spatio-temporal expression pattern of OsSDH2-1, RPS14 and OsSDH2-2 in the wild type. (A,B) Expression pattern comparison between OsSDH2-1 and RPS14 in young and adult plants. R: root, S: stem, L: leaf blade, YP: young panicle, and LS: leaf sheath. (C,D) Expression pattern comparison between OsSDH2-1 and OsSDH2-2 in seeds at germination stage, respectively. Actin 1 was examined as the internal control. Error bars represent standard deviations of three independent biological replicates.

