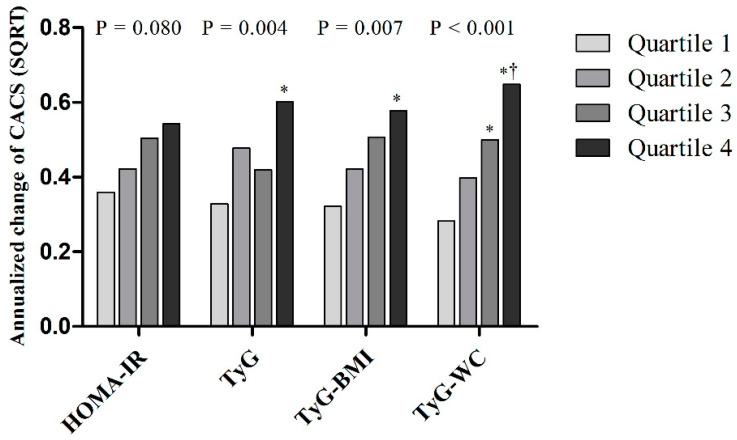
Figure 3.
Annualized change of CAC according to quartiles of each parameter in the final cohort including non-progressors and progressors (n = 1145). The p-values indicate overall p-value of the ANOVA and the symbols indicate results from the post hoc test of Scheffe’s method (* p < 0.05 vs. Quartile 1, † p < 0.05 vs. Quartile 2).

