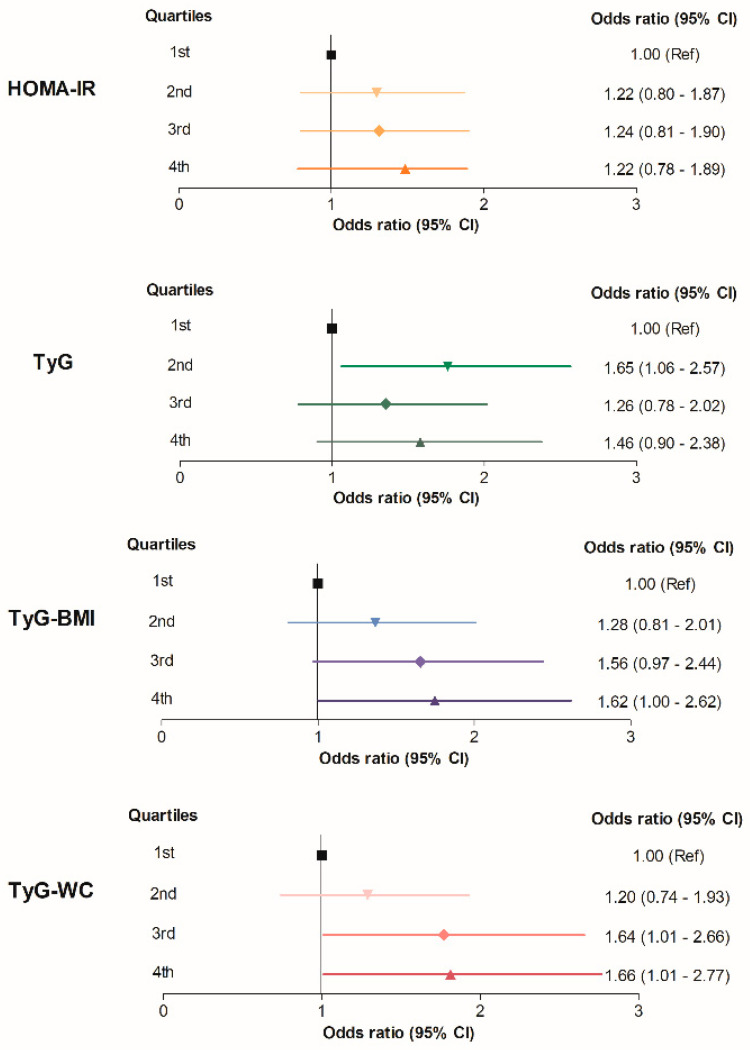
Figure 4.
Summarized figure for CAC progression risk according to the quartiles of each parameter in the final cohort including non-progressors and progressors (n = 1145). The ORs (95% CIs) are adjusted for age, sex, systolic BP, LDL-C, HDL-C, smoking, drinking, exercise habits, baseline CAC score, and follow-up interval.

