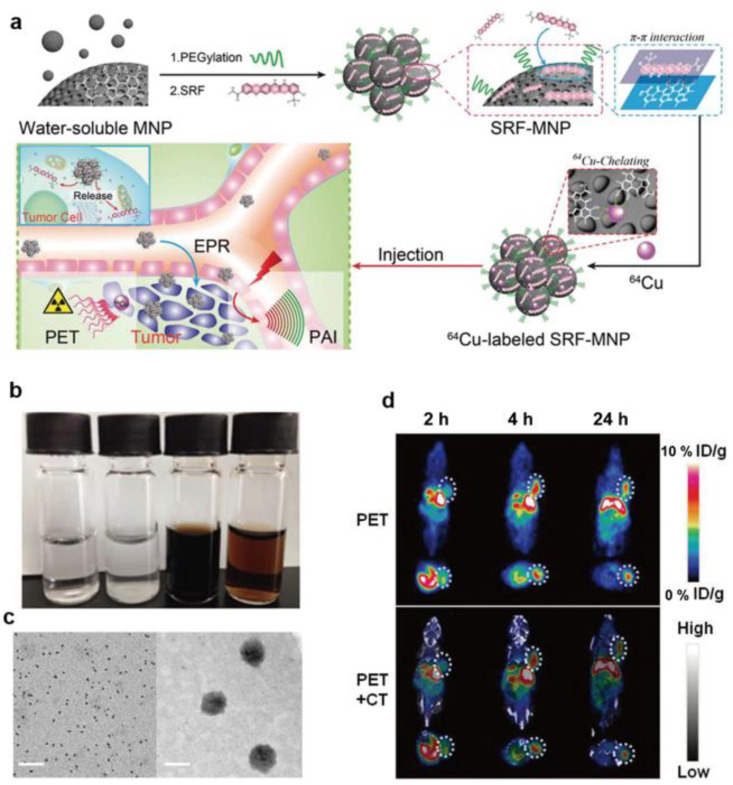
Figure 7.
The preparation of 64Cu2+ chelated SRF-MNPs and in vivo PET images of nanoparticles. (a) Schematic illustration of the preparation of SRP-MNPs and therapy process in vivo. (b) The photographs of different groups (from left to right): (1) pure water, (2) SRF precipitated in PBS, (3) PEG-MNP dispersed in PBS, and (4) SRF dispersed in PBS having PEG-MNP. (c) TEM of PEG-MNP (left) and SRF-MNP (right), scale bar = 50 nm. (d) Representative decay-corrected coronal (top) and transaxial (bottom) small-animal PET images and overlaid CT and PET images of HepG2 tumor (region enveloped by white dotted line) acquired at different times post injection with 64Cu2+ chelated SRF-MNPs [82].

