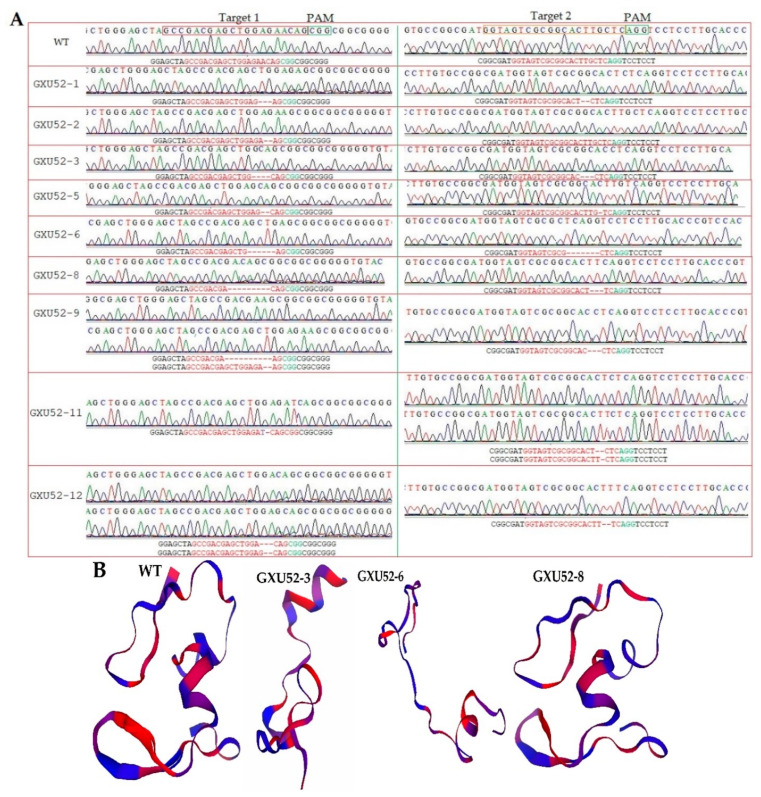
Figure 2.
Sequence chromatograms and protein modeling of T0 mutant plants. (A) Sequencing peaks for wild type (WT) and mutant plants. Base deletion and insertion are represented with “-” and purple letters, respectively. Red and green letters are the target regions and protospacer adjacent motif (PAM) sequence, respectively; (B) the three-dimensional protein structures of the WT and mutant lines.

