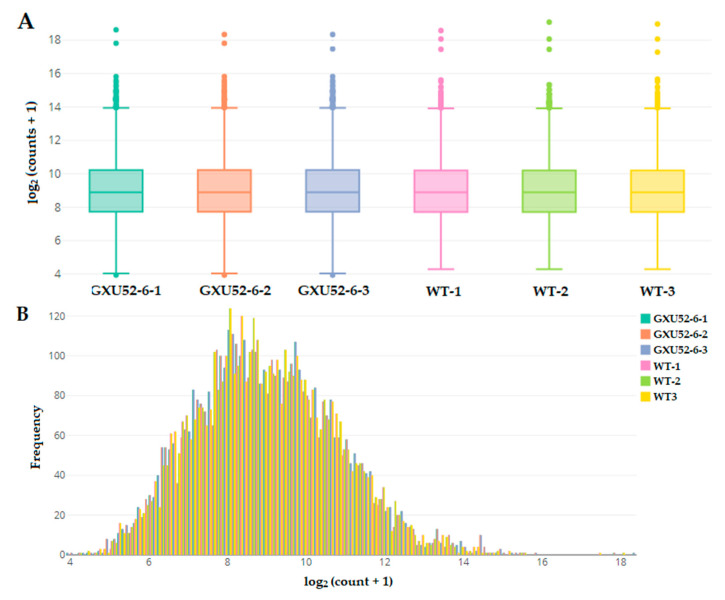
Figure 4.
Basic information about proteomic analysis of the wild type (WT) and mutant line (GXU52-6). (A) Box-and-whisker plot of proteomic count data distribution with log2 values of the normalized abundance; (B) Histogram for count data distribution frequency of transformed data from WT and mutant line.

