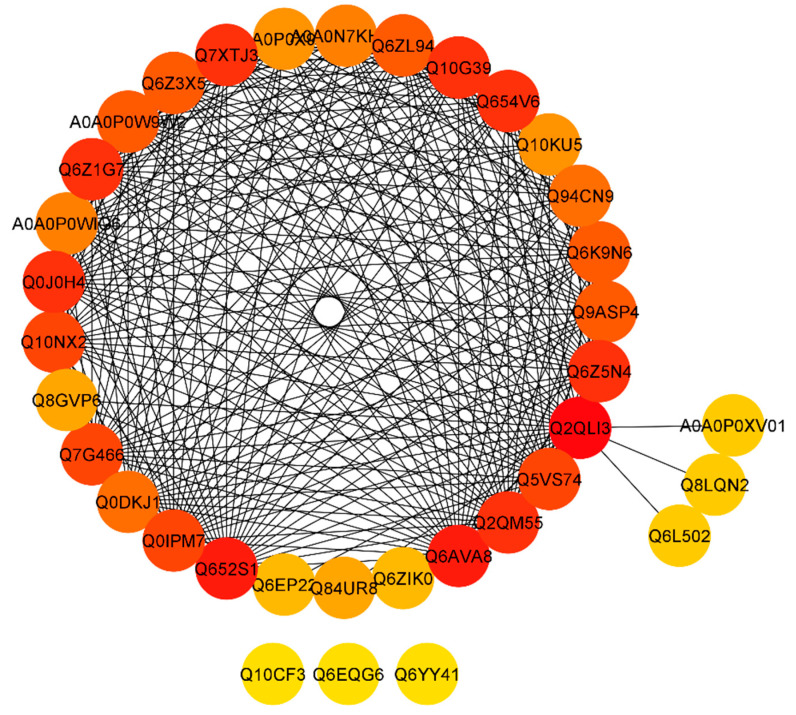
Figure 6.
STRING software predicted protein to the protein network of differentially expressed proteins (DEPs). Differentially accumulated proteins are represented by a node, whereas the different color of lines represents evidence for the predicted functional relationship. The strong interaction is indicated by redder color. The proteins outside the circle showed no or weak interaction.

