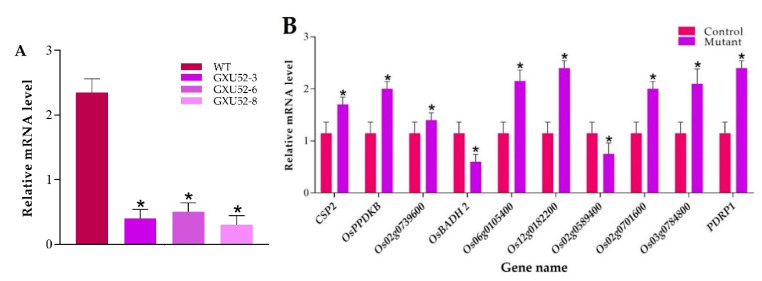
Figure 7.
Real-time quantitative PCR validation of the OsSPL16 expression level in wild type (WT) and mutant lines, and ten selected differentially expressed proteins (DEPs) responsive genes under normal conditions. (A) Expression analysis of OsSPL16 in WT and mutant lines (B) Relative expression level of ten selected DEPs responsive genes. The data were analyzed by three independent repeats, and standard deviations were shown with error bars. Significant differences in expression level were indicated by “*”, Student’s t-test, p ≤ 0.01.

