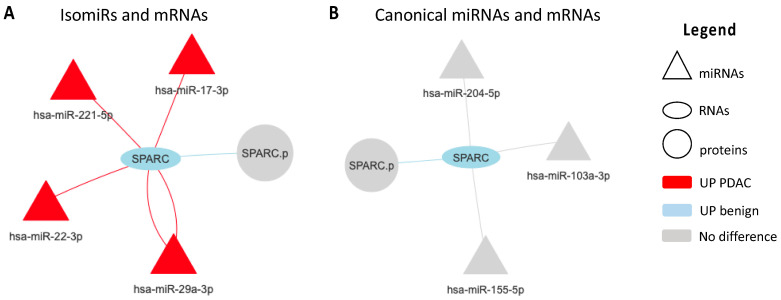
Figure 3.
Networks focused on SPARC and based on correlation analyses of miRNAs, RNAs and proteins in PDAC platelets. A node-to-node connection is only seen if the nodes satisfy the expected correlation rule (negative correlation between miRNA and mRNAs, and positive correlation between mRNAs and proteins). (A) expected correlations between isomiRs and mRNA data; (B) expected correlations between canonical miRNAs and mRNA data; In isomiRs data each connection represents one isomiRs type, red and light blue colors represent up-regulation in PDAC and benign platelets, respectively. Triangle, oval and circle represents miRNAs, RNAs and proteins, respectively.

