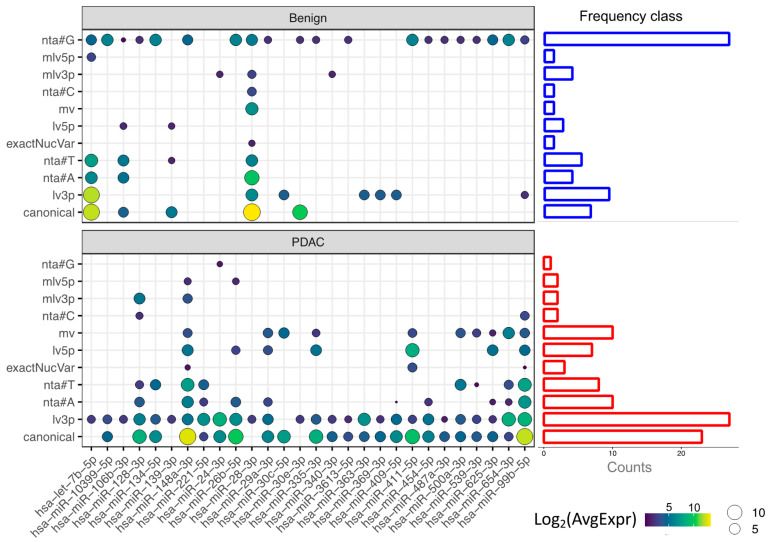
Figure 6.
Heatmap of differentially expressed miRNAs and their average expression log2 transformed in benign (upper panel) and PDAC platelets (bottom panel) following the type of isomiR: (i) canonical; (ii) length variant in 3′; (iii) non-templated addition of base A; (iv) non-templated addition of base T; (v) exact nucleotide variant; (vi); length variant in 5′ (vii) multiple variant; (viii) non-templated addition of base C; (ix) multiple variant in 3′; (x) multiple variant in 5′; (xii) non-templated addition of base G. Side barplots represent the frequency of the isomiR class in benign platelets (blue) and PDAC platelets (red).

