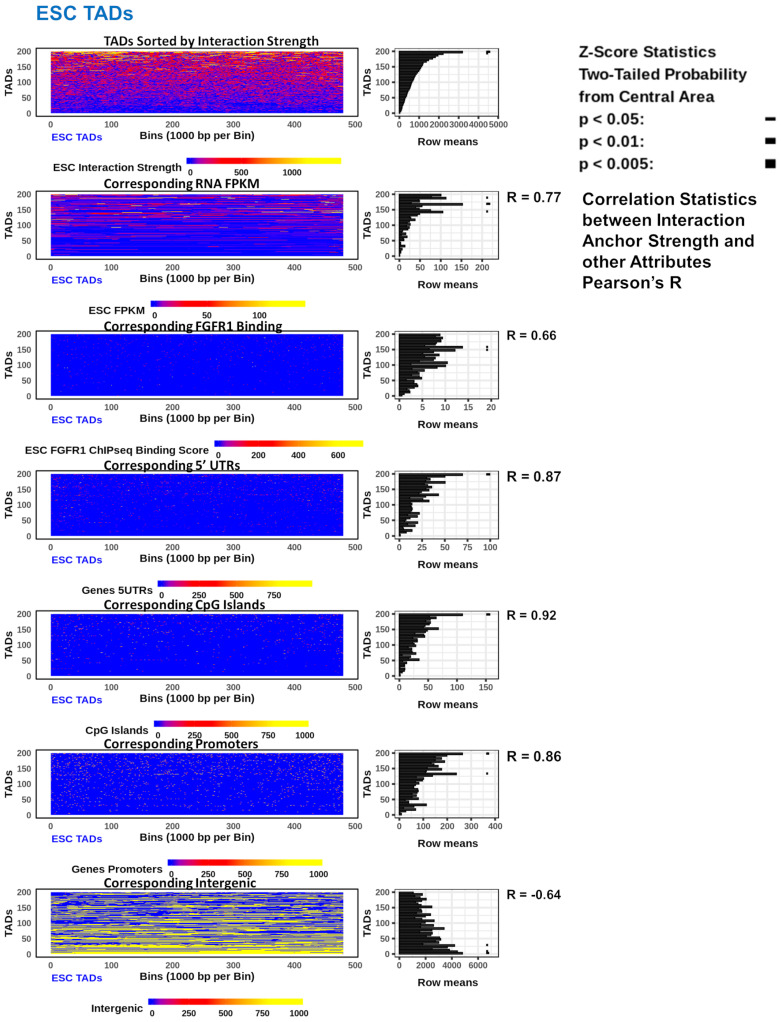
Figure 4.
Interaction strength correlates with gene coding, regulatory features, and nFGFR1 in ESC TADs. 200 TADs of 480 kb stacked as rows in descending order by interaction strength within each TAD. Heatmaps show the feature span (gene coding and regulatory features) or strength (interaction strength, RNA FPKM, nFGFR1 binding) throughout each TAD and a mean plot of the heatmap rows in 5 TAD bins. Pearson’s R values were calculated between interaction strength and each of the corresponding attributes in 5 TAD bins. Right panels to each heatmap show average interaction strength sorted feature enrichments across same sized TADs. Z-Score statistics indicate bins which are outside the mean of all bins p < 0.05 ; p < 0.01
 ; p < 0.005
 .
.

