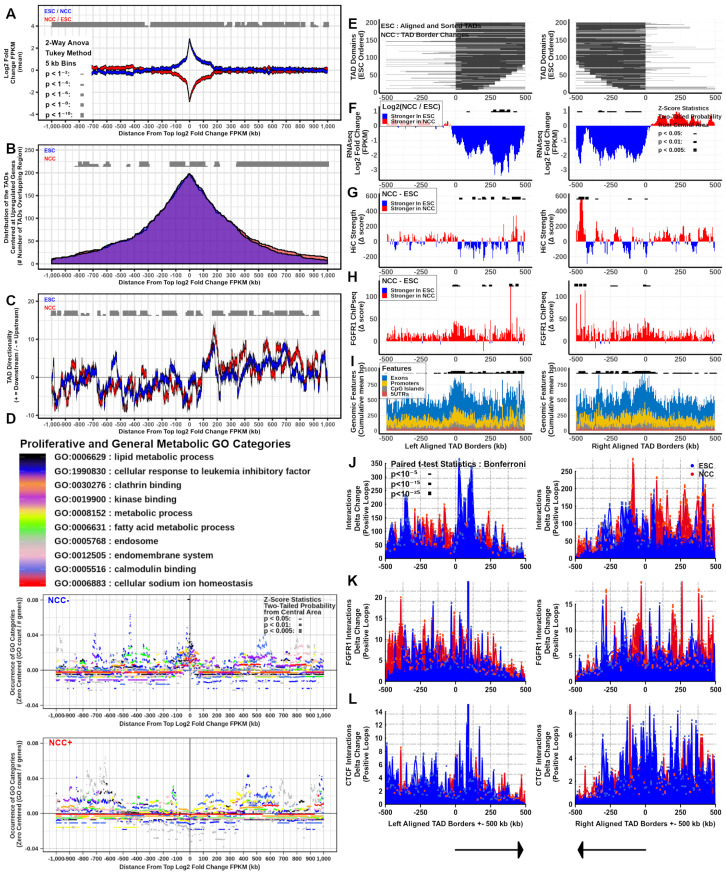
Figure 6.
Downregulated TADs express stage specific genes and are reorganized during ESC to NCC differentiation. At interacting (q < 0.001) upregulated and downregulated anchor-anchor midpoints: (A) Differential gene expression. (B) TAD overlap. (C) Directionality Index. (D) Gene Ontology Category Enrichment. Two-way ANOVA Tukey Method: ESC versus NCC for each location shown, p < 1−2 ; p < 1−4
 ; p < 1−6
 ; p < 1−8
 ; p < 1−10
 . At TAD borders aligned left and right based on regulated gene directionality (adjusted p < 0.05): (E) TAD reorganization. (F) Differential gene expression. (G) Differential interaction anchor strength. (H) Differential nFGFR1 binding. (I) Differential gene coding and regulator feature enrichment. Z-Score statistics indicate bins which are outside the mean of all bins p < 0.05
 ; p < 0.01
 ; p < 0.005
 . (J) Differential chromatin looping. (K) Differential nFGFR1 looping. (L) Differential CTCF looping. Paired T-Test Bonferroni adjusted p < 10−5
 ; p < 10−15
 ; p < 10−25
 .
.

