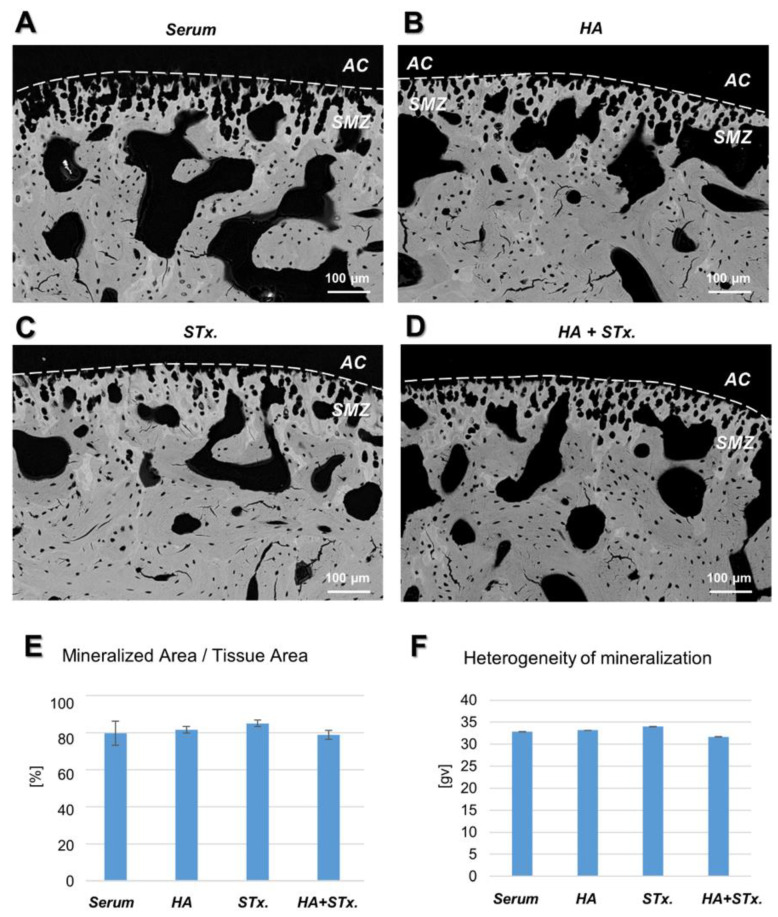
Figure 4.
Representative back-scattered images of temporomandibular joint (TMJ) specimens of all groups. (A–D) The images show a cross-sectional view of the TMJ, whereby darker pixels correspond to a low degree of mineralization and brighter pixels correspond to higher degree of mineralization. The articular cartilage (AC) is located on top of the subchondral mineralized zone (SMZ) which is composed of calcified cartilage containing chondrocyte lacunae and subchondral bone containing osteocyte lacunae. (E) In the calcified cartilage zone, the ratio of mineralized area per tissue area, an inverse measure of tissue porosity, was similar between the groups. (F) The heterogeneity of mineralization, assessed as the full-width-half-maximum of the gray value histogram, was similar between groups.

