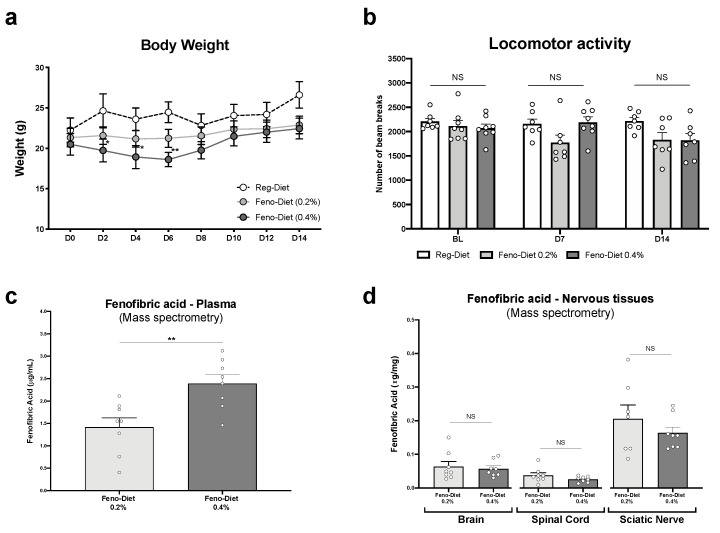
Figure 1.
Tolerability of fenofibrate diet and plasma and tissue levels of fenofibrate: (a) body weight measurement every other day for two weeks; (b) locomotor activity measured at baseline (BL), day 7 (D7) and day 14 (D14) in animals treated with regular, fenofibrate 0.2% and fenofibrate 0.4% diets. (c,d) Plasma and central and peripheral nervous tissues’ concentration of fenofibric acid, the active metabolite of fenofibrate, measured by mass spectrometry. Values are expressed as mean ± SEM. n = 8/group. Results were compared using two-way ANOVA (a), one-way ANOVA (b) with post-hoc Tukey’s test and t-test (c,d) (*: p < 0.05, **: p < 0.01 vs. vehicle). No sex differences were observed (data not shown).

