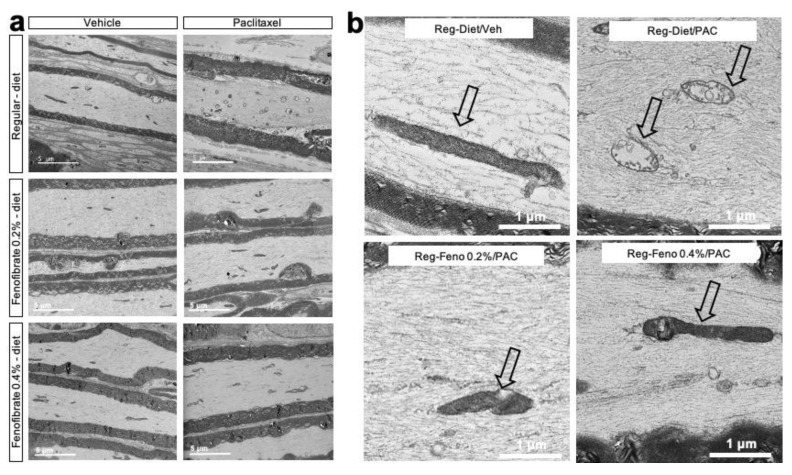
Figure 4.
Morphological features of sciatic nerves: Transmission electron microscopy pictures of sciatic nerve longitudinal sections after different treatments (a,b). Magnification on mitochondria (black arrow) showing mitochondrial ultrastructure in the control group (Vehicle), the paclitaxel-treated group (Paclitaxel), the paclitaxel + fenofibrate 0.2%-treated group and the paclitaxel + fenofibrate 0.4%-treated group (b). Feno = Fenofibrate; Reg = Regular; PAC = paclitaxel; Veh = Vehicle.

