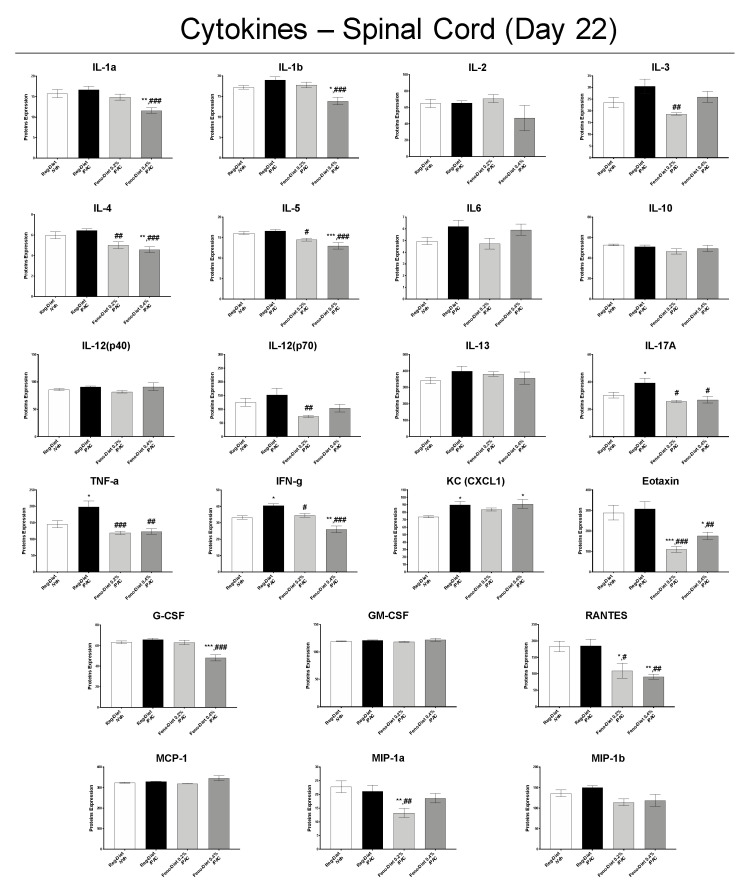
Figure 7.
Measurement of inflammation markers in spinal cord 22 days after injection of paclitaxel with or without 0.2% or 0.4% fenofibrate diet. Values are expressed as mean ± SEM. n = 8/group. Results were compared using one-way ANOVA and post-hoc Tukey’s test (*: p < 0.05, **: p < 0.01 and ***: p < 0.001 vs. vehicle group; #: p < 0.05, ##: p < 0.01 and ###: p < 0.001 vs. paclitaxel group). D = day; Feno = Fenofibrate; Reg = Regular; PAC = paclitaxel; Veh = Vehicle. No sex differences were observed (data not shown).

