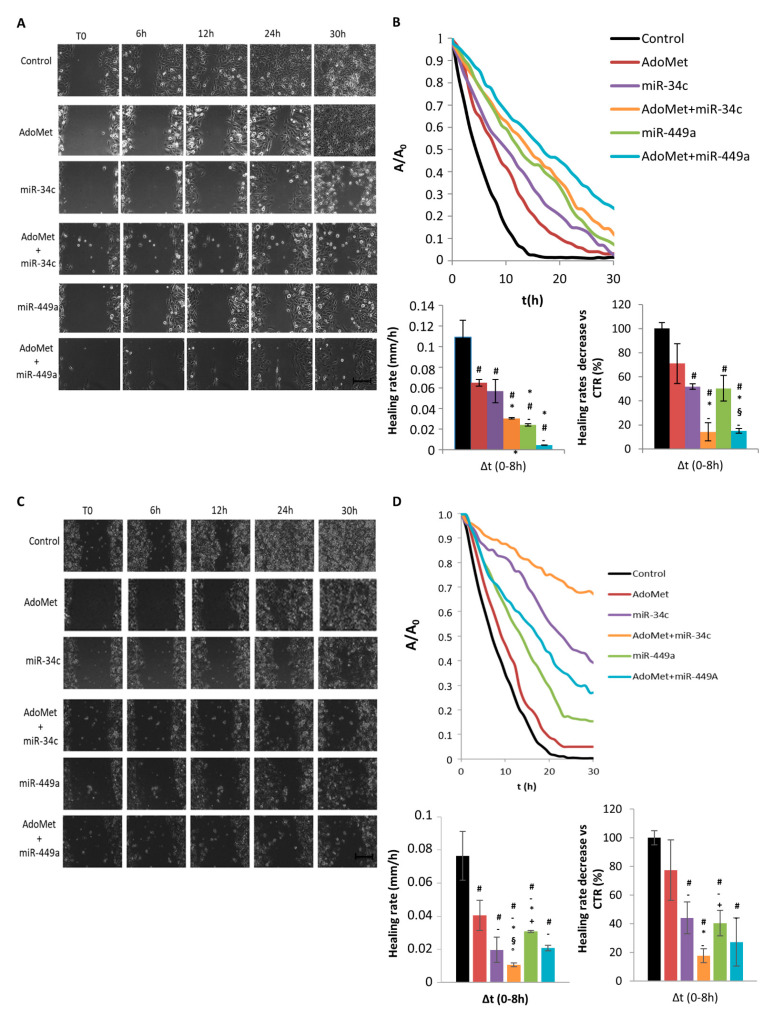
Figure 3.
Effect of AdoMet/miR-34c and AdoMet/miR-449a combination on cell migration in MDA-MB-231 and MDA-MB 468 cells. Representative phase-contrast microscopy images showing the wound closure process at five different time points in MDA-MB-231 (A) and MDA-MB-468 cells (C) transfected with miR-34c or miR-449a and incubated or not (Control) with AdoMet. Images in the panels are relative to a single field of view, taken as qualitatively representative of a given experimental condition. Scale bar, 100 μm. Evolution in time of the wound area A, normalized to the value A0 at time 0 (T0), for MDA-MB-231 ((B) upper) and MDA-MB 468 cells ((D) upper) transfected with miR-34c or miR-449a and incubated or not (Control) with AdoMet. Bar diagrams show the values of the healing rate in the time range 0–8 h for control and treated MDA-MB-231 ((B) bottom left) and MDA-MB 468 cells ((D) bottom left) and the effect of AdoMet and miRNAs on healing rate of MDA-MB-231 ((B), bottom right) and MDA-MB-468 ((D), bottom right) cells, calculated as percentage of the control in the range time 0–8 h. The data represent an average of three independent experiments; data shown are means ± SD; The statistical significance was analyzed through one-way ANOVA and Tukey post hoc test for comparing a family of 6 estimates: # p < 0.05 or less vs. untreated-cells (Control); * p < 0.05 or less vs. miR-34c, + p < 0.05 or less vs. miR-34c + AdoMet; - p < 0.05 or less vs. AdoMet, § p < 0.05 or less vs. miR-449a, ° p < 0.05 or less vs. miR-449a + AdoMet.

