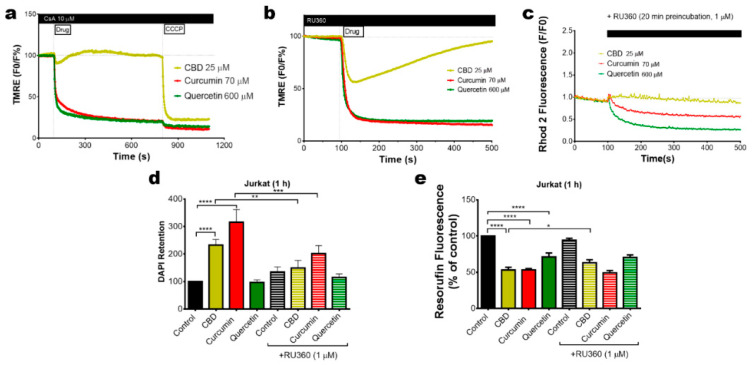
Figure 4.
Pharmacology of the mitochondrial Ca2+ and ∆Ψm changes induced by cytotoxic phenols. (a) The effect of the mPTP inhibitor (CsA, 20 min preincubation) on ∆Ψm in TMRE-stained Jurkat cells, treated with phenols. Traces represent the average of three independent experiments. CCCP (10 µM) was added as a control at the end of each experiment. (b) Effect of Ru360 (1 µM, 20 min preincubation) on ∆Ψm in TMRE-stained Jurkat cells, treated with phenols. Traces represent the average of three independent experiments. (c) Effect of the MCU inhibitor Ru360 preincubation (1 µM) over the mitochondrial Ca2+ changes, induced by phenols, in Jurkat cells stained with Rhod-2 (2 µM). Traces represent the average of three independent experiments. Effect of Ru360 (1 µM, 20 min preincubation) on the cell death (d) or metabolism (e) of Jurkat cells, treated with CBD (25 µM), curcumin (70 µM) or quercetin (600 µM). Bars represent the average of three independent experiments ± SD, analyzed by a one-way ANOVA test (* p < 0.05; ** p < 0.01; *** p < 0.001; **** p < 0.0001).

