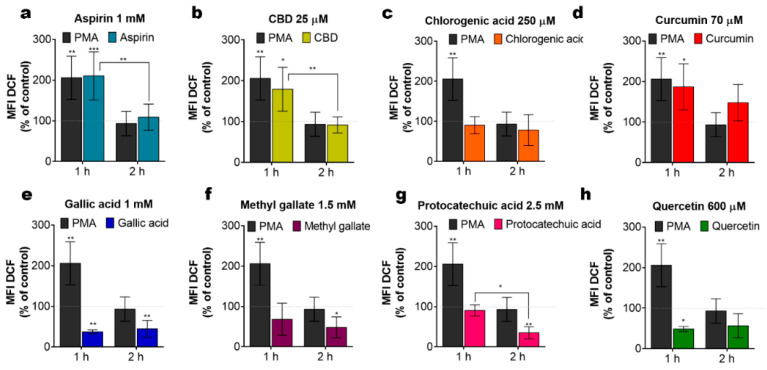
Figure 5.
Intrinsic ROS levels in Jurkat cells, treated with different phenolic compounds. (a–h) Cells were stained with the indicator of ROS activity 2′, 7′-Dichlorodihydrofluorescein diacetate, DCF-DA (5 µM, 30 min) at 1 h or 2 h of treatment. DCF fluorescence was collected by flow cytometry (10,000 events per sample) and mean fluorescence intensity (MFI) was determined. The MFI value of the untreated cell population was taken as 100% (dotted line). Treatment with phorbol 12 myristate 13 acetate, PMA (5 µM) was used as a positive control. Data are mean ± SD (data from at least three independent experiments; * p < 0.05; ** p < 0.01; *** p < 0.001; two-way ANOVA).

